Fieldwise

Data-driven farming UX

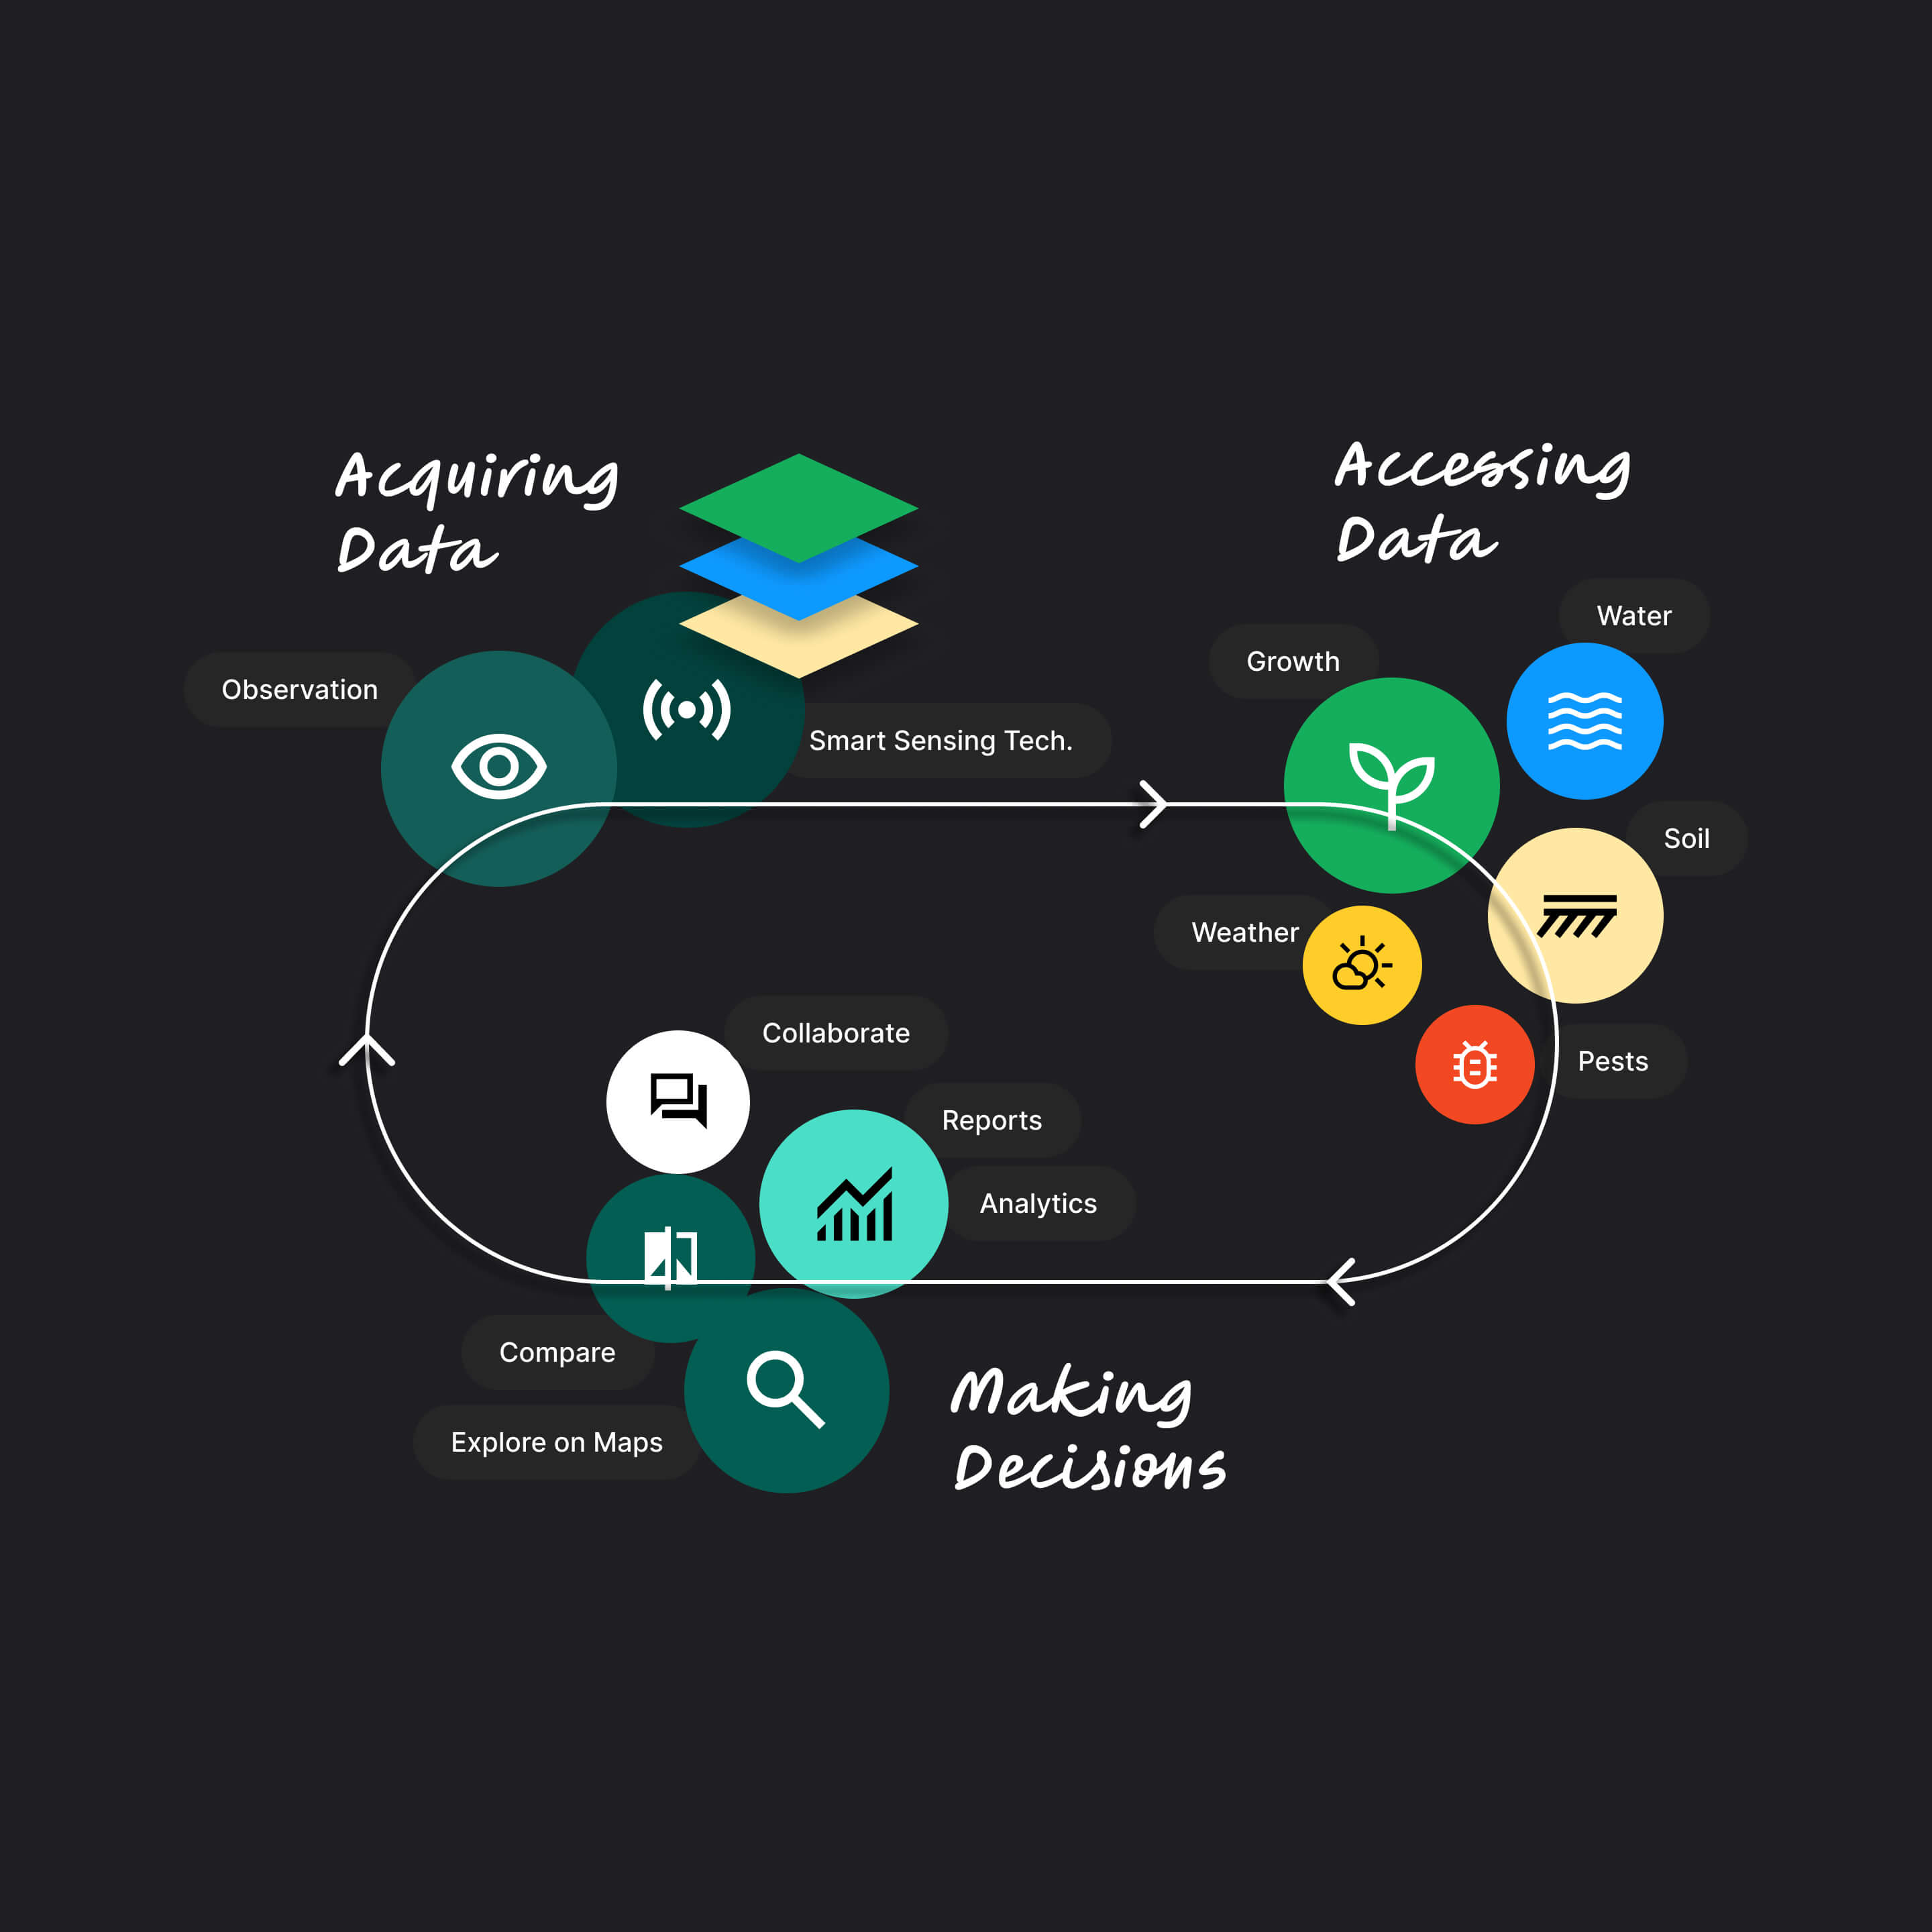
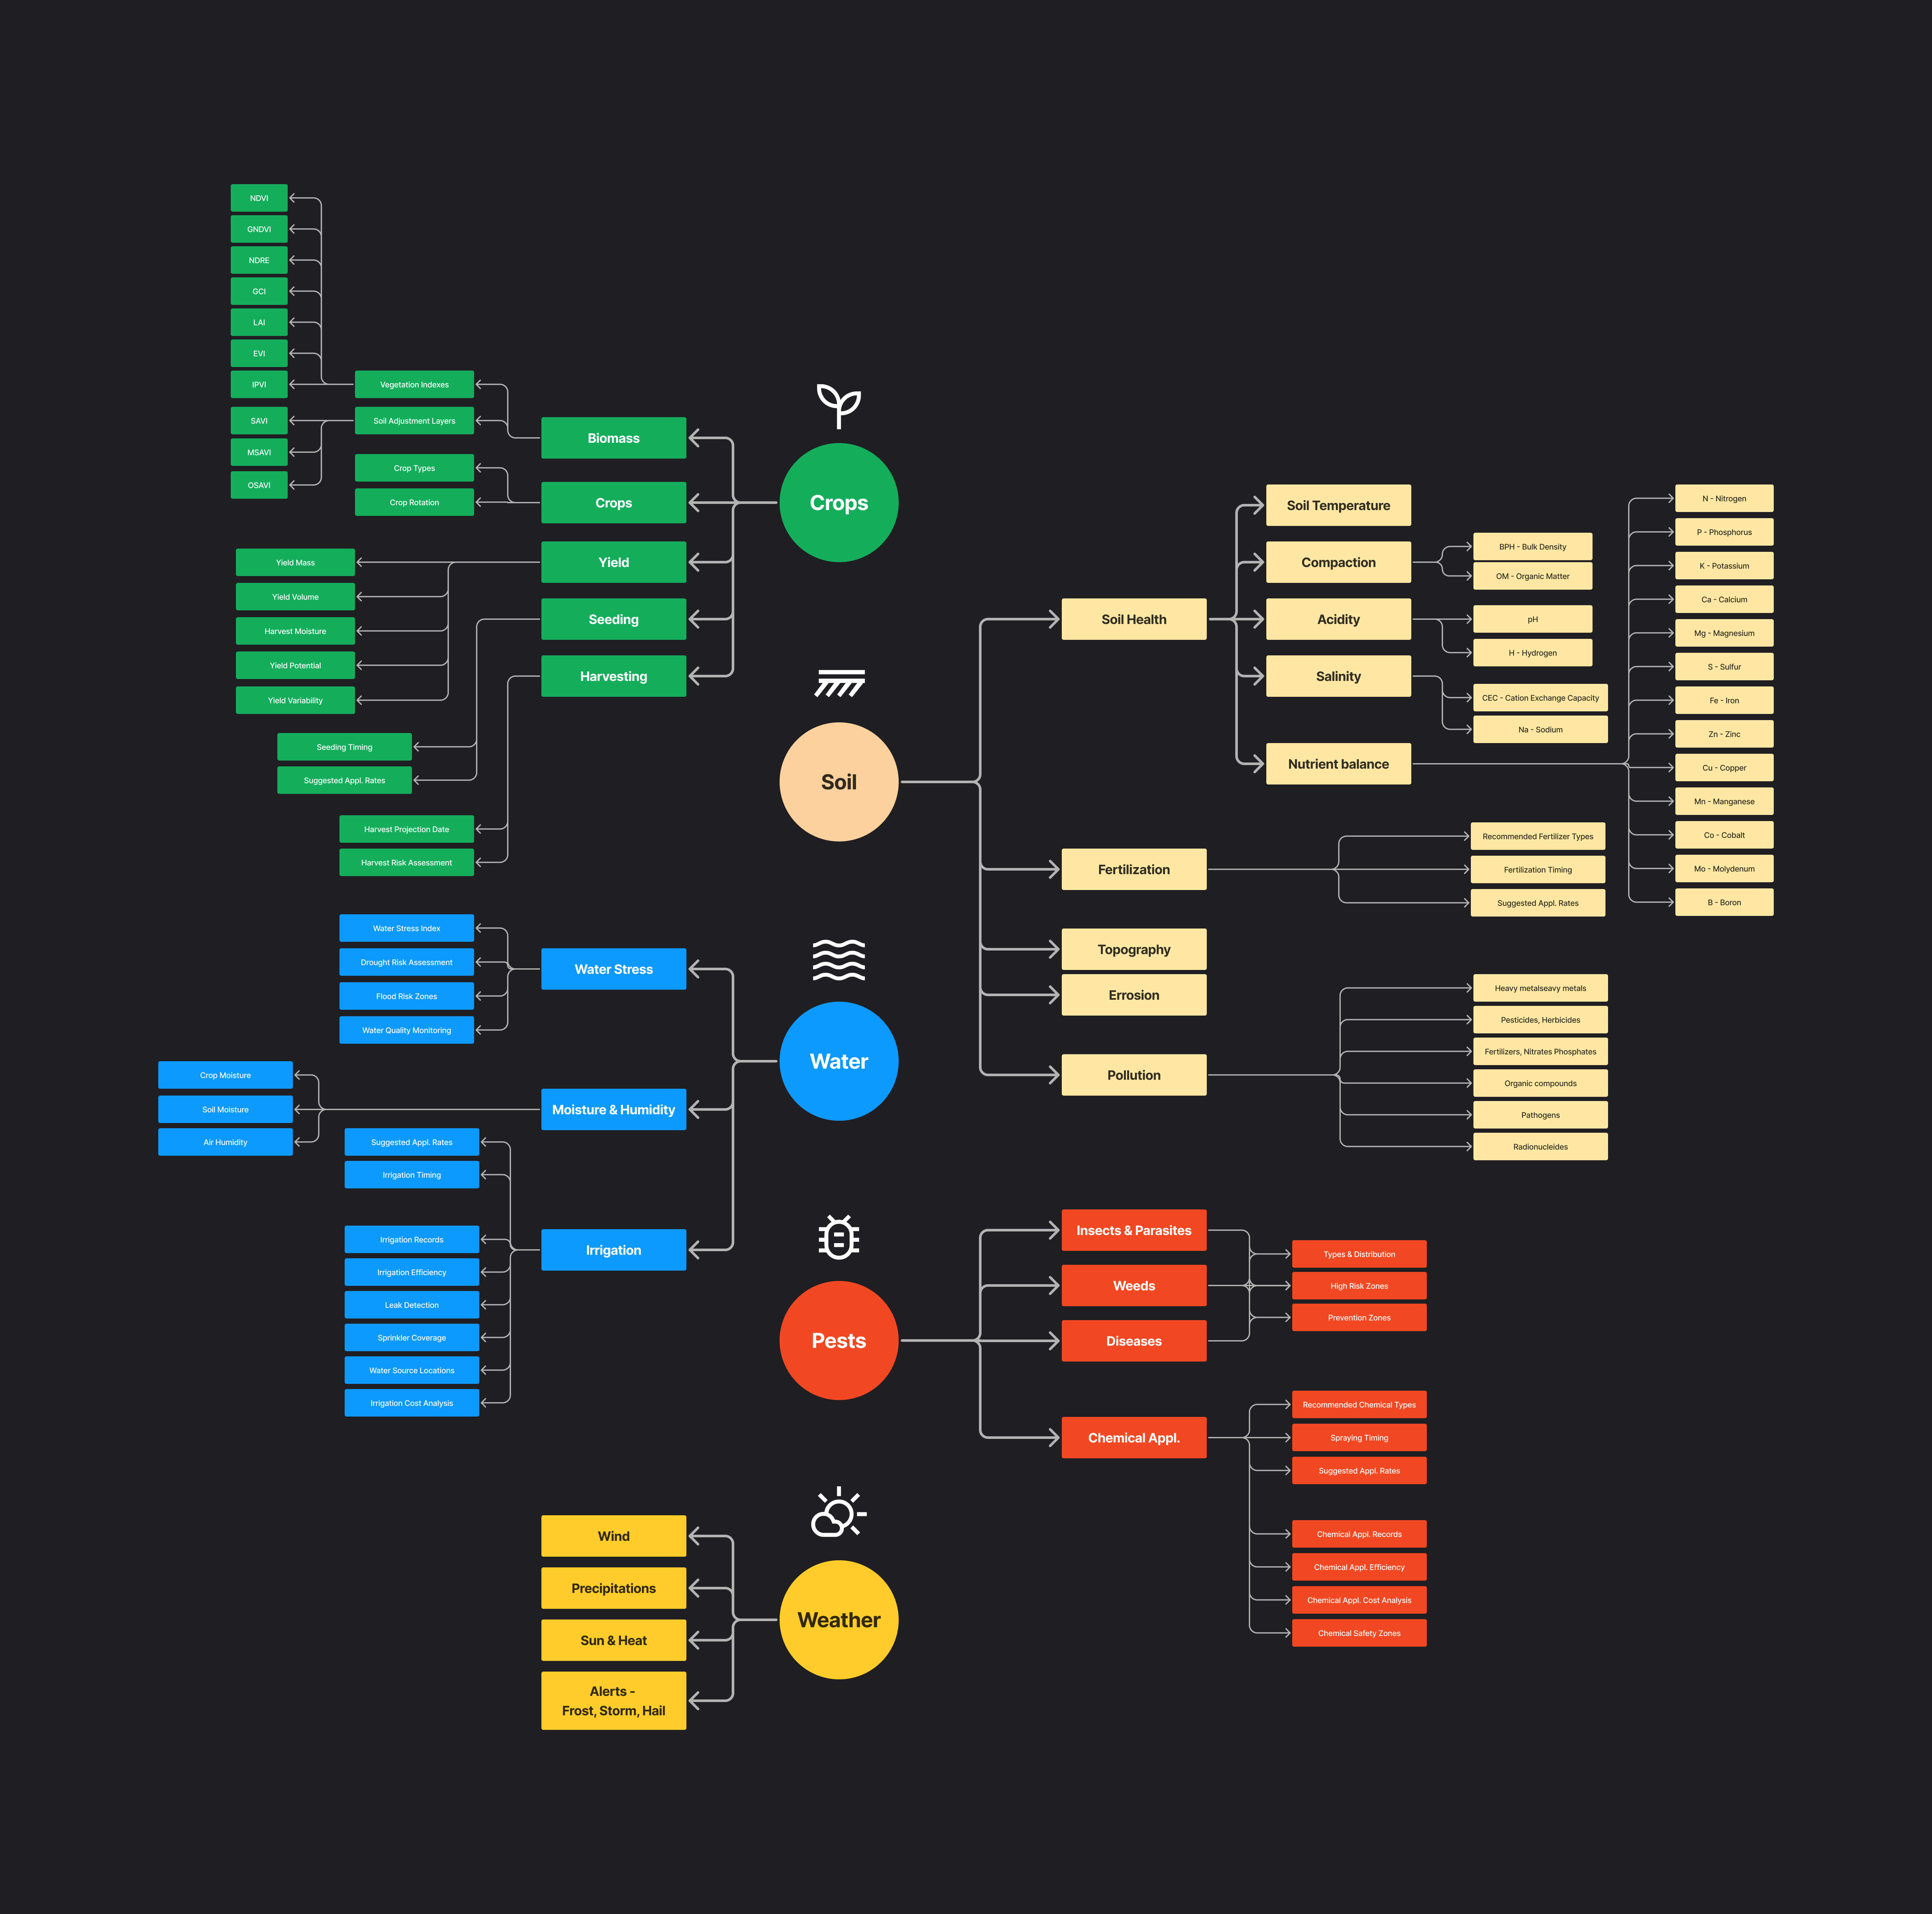
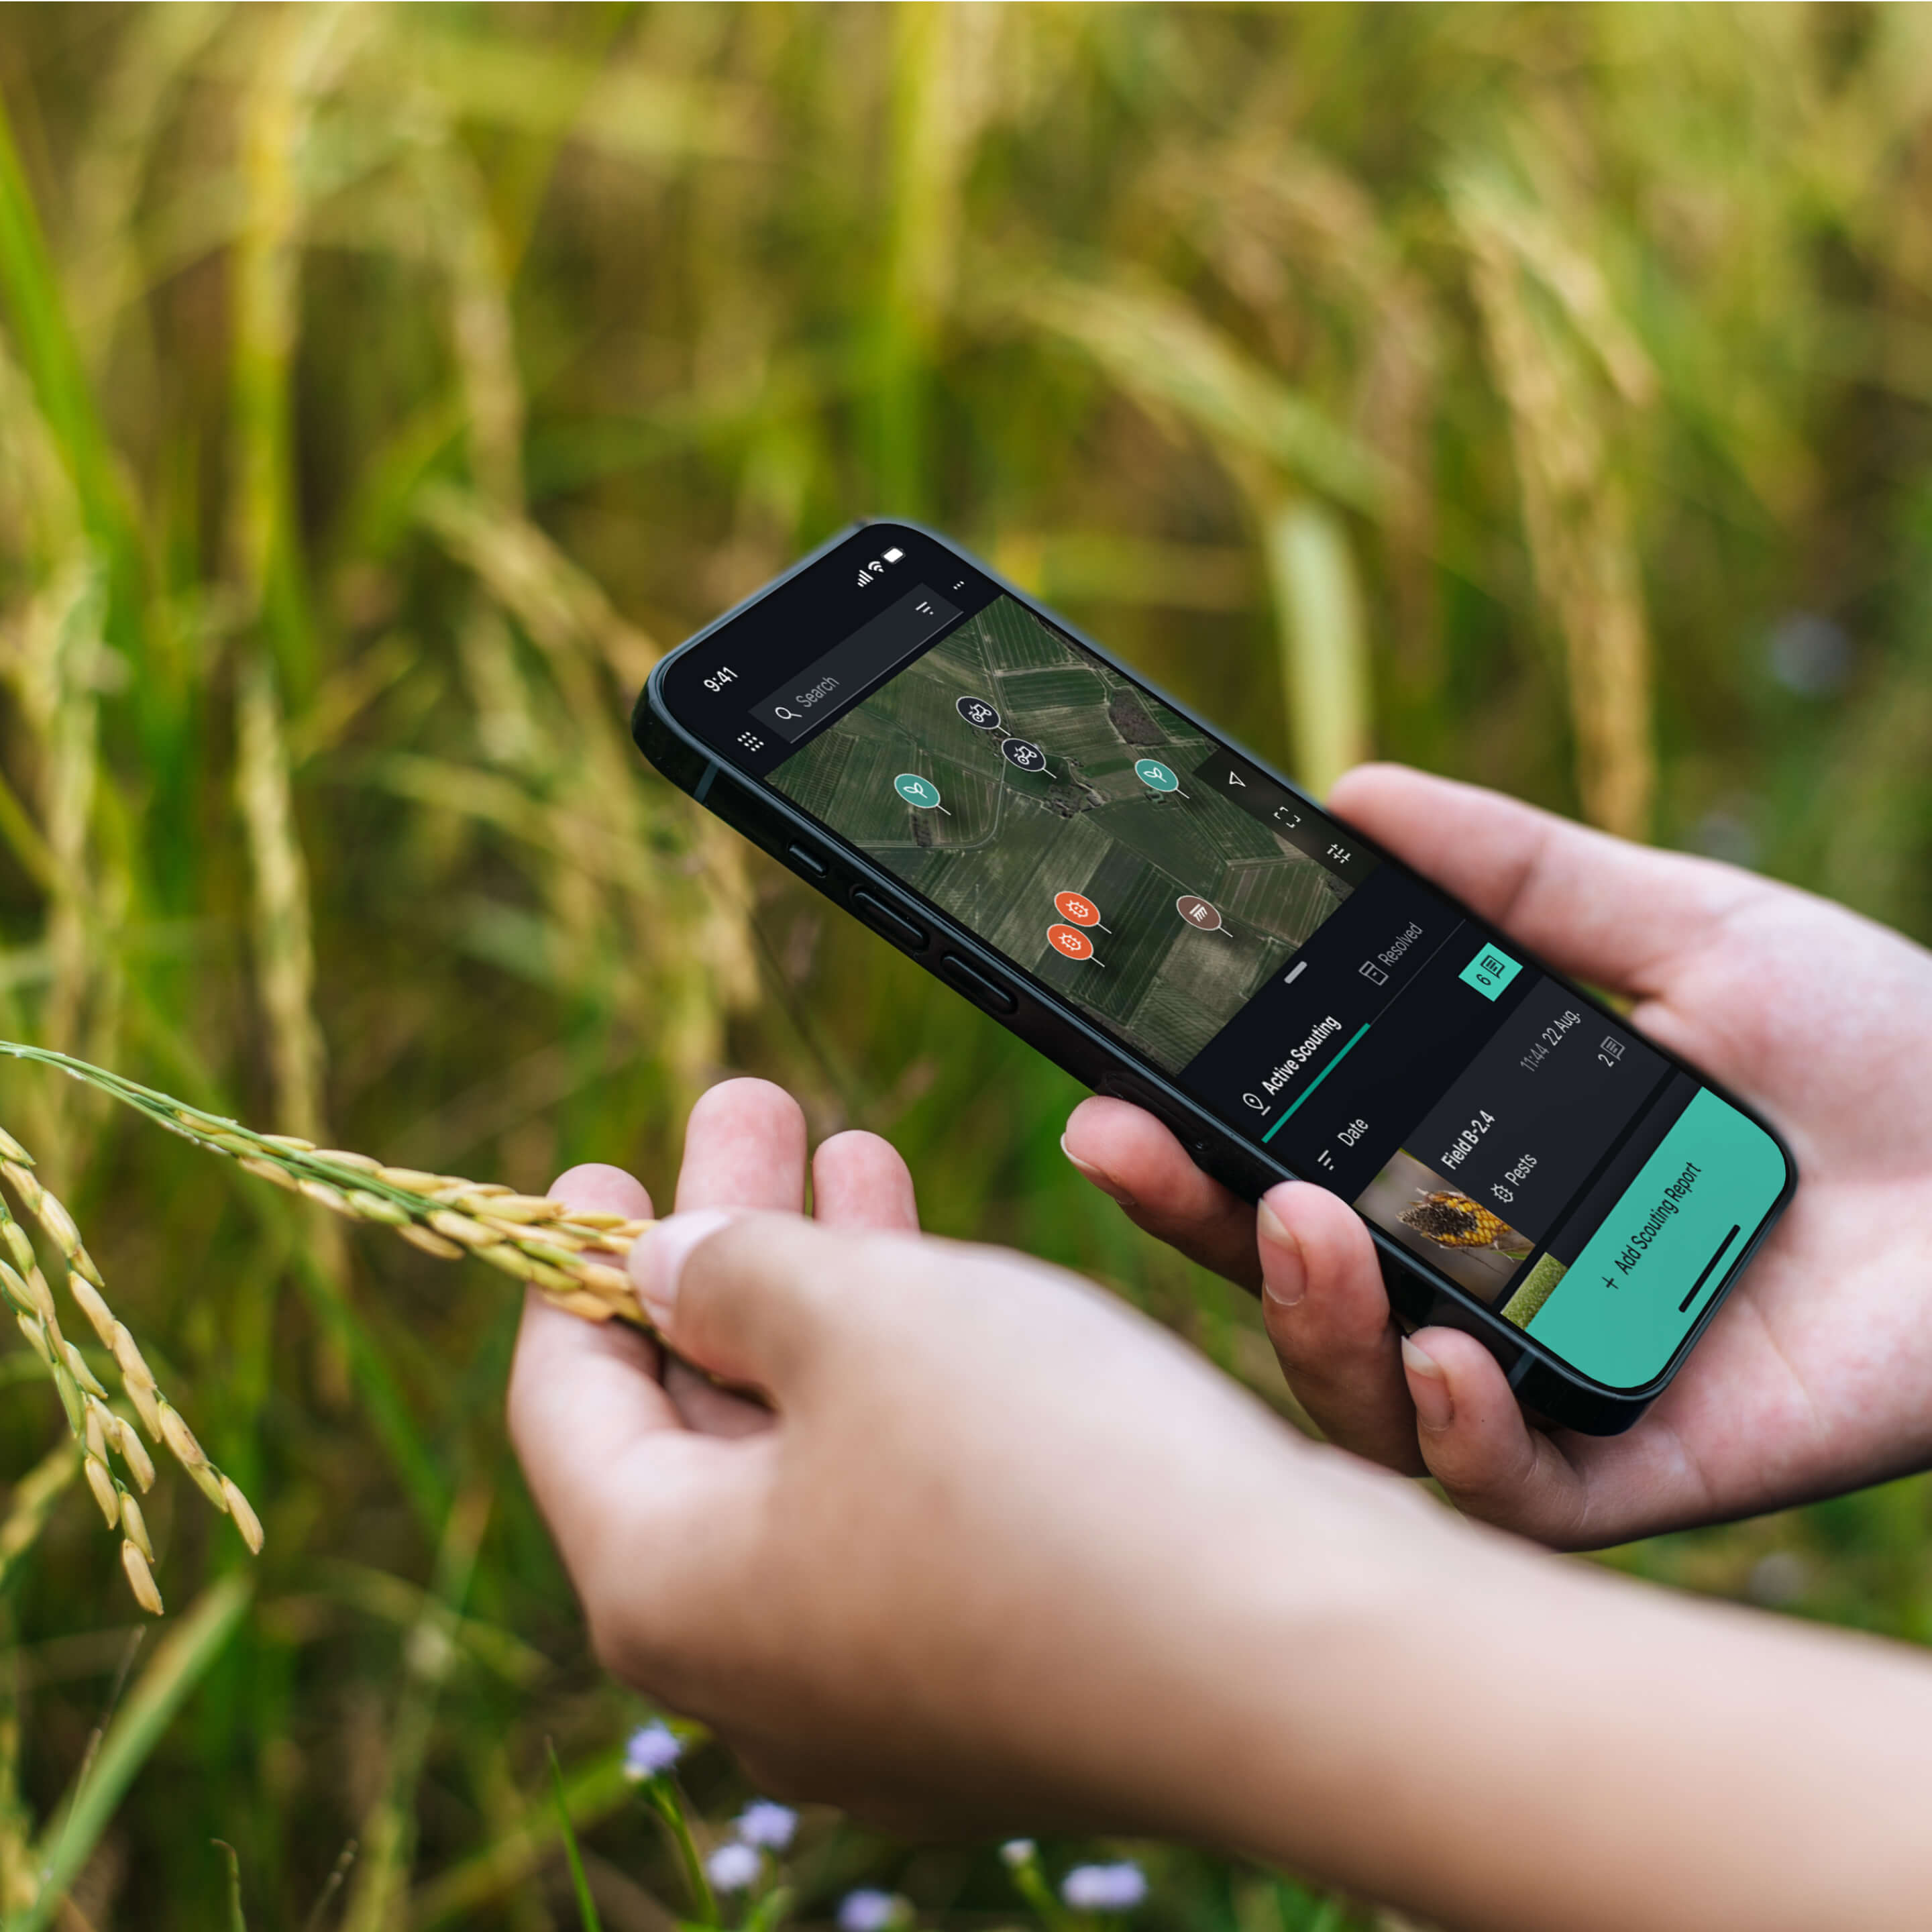
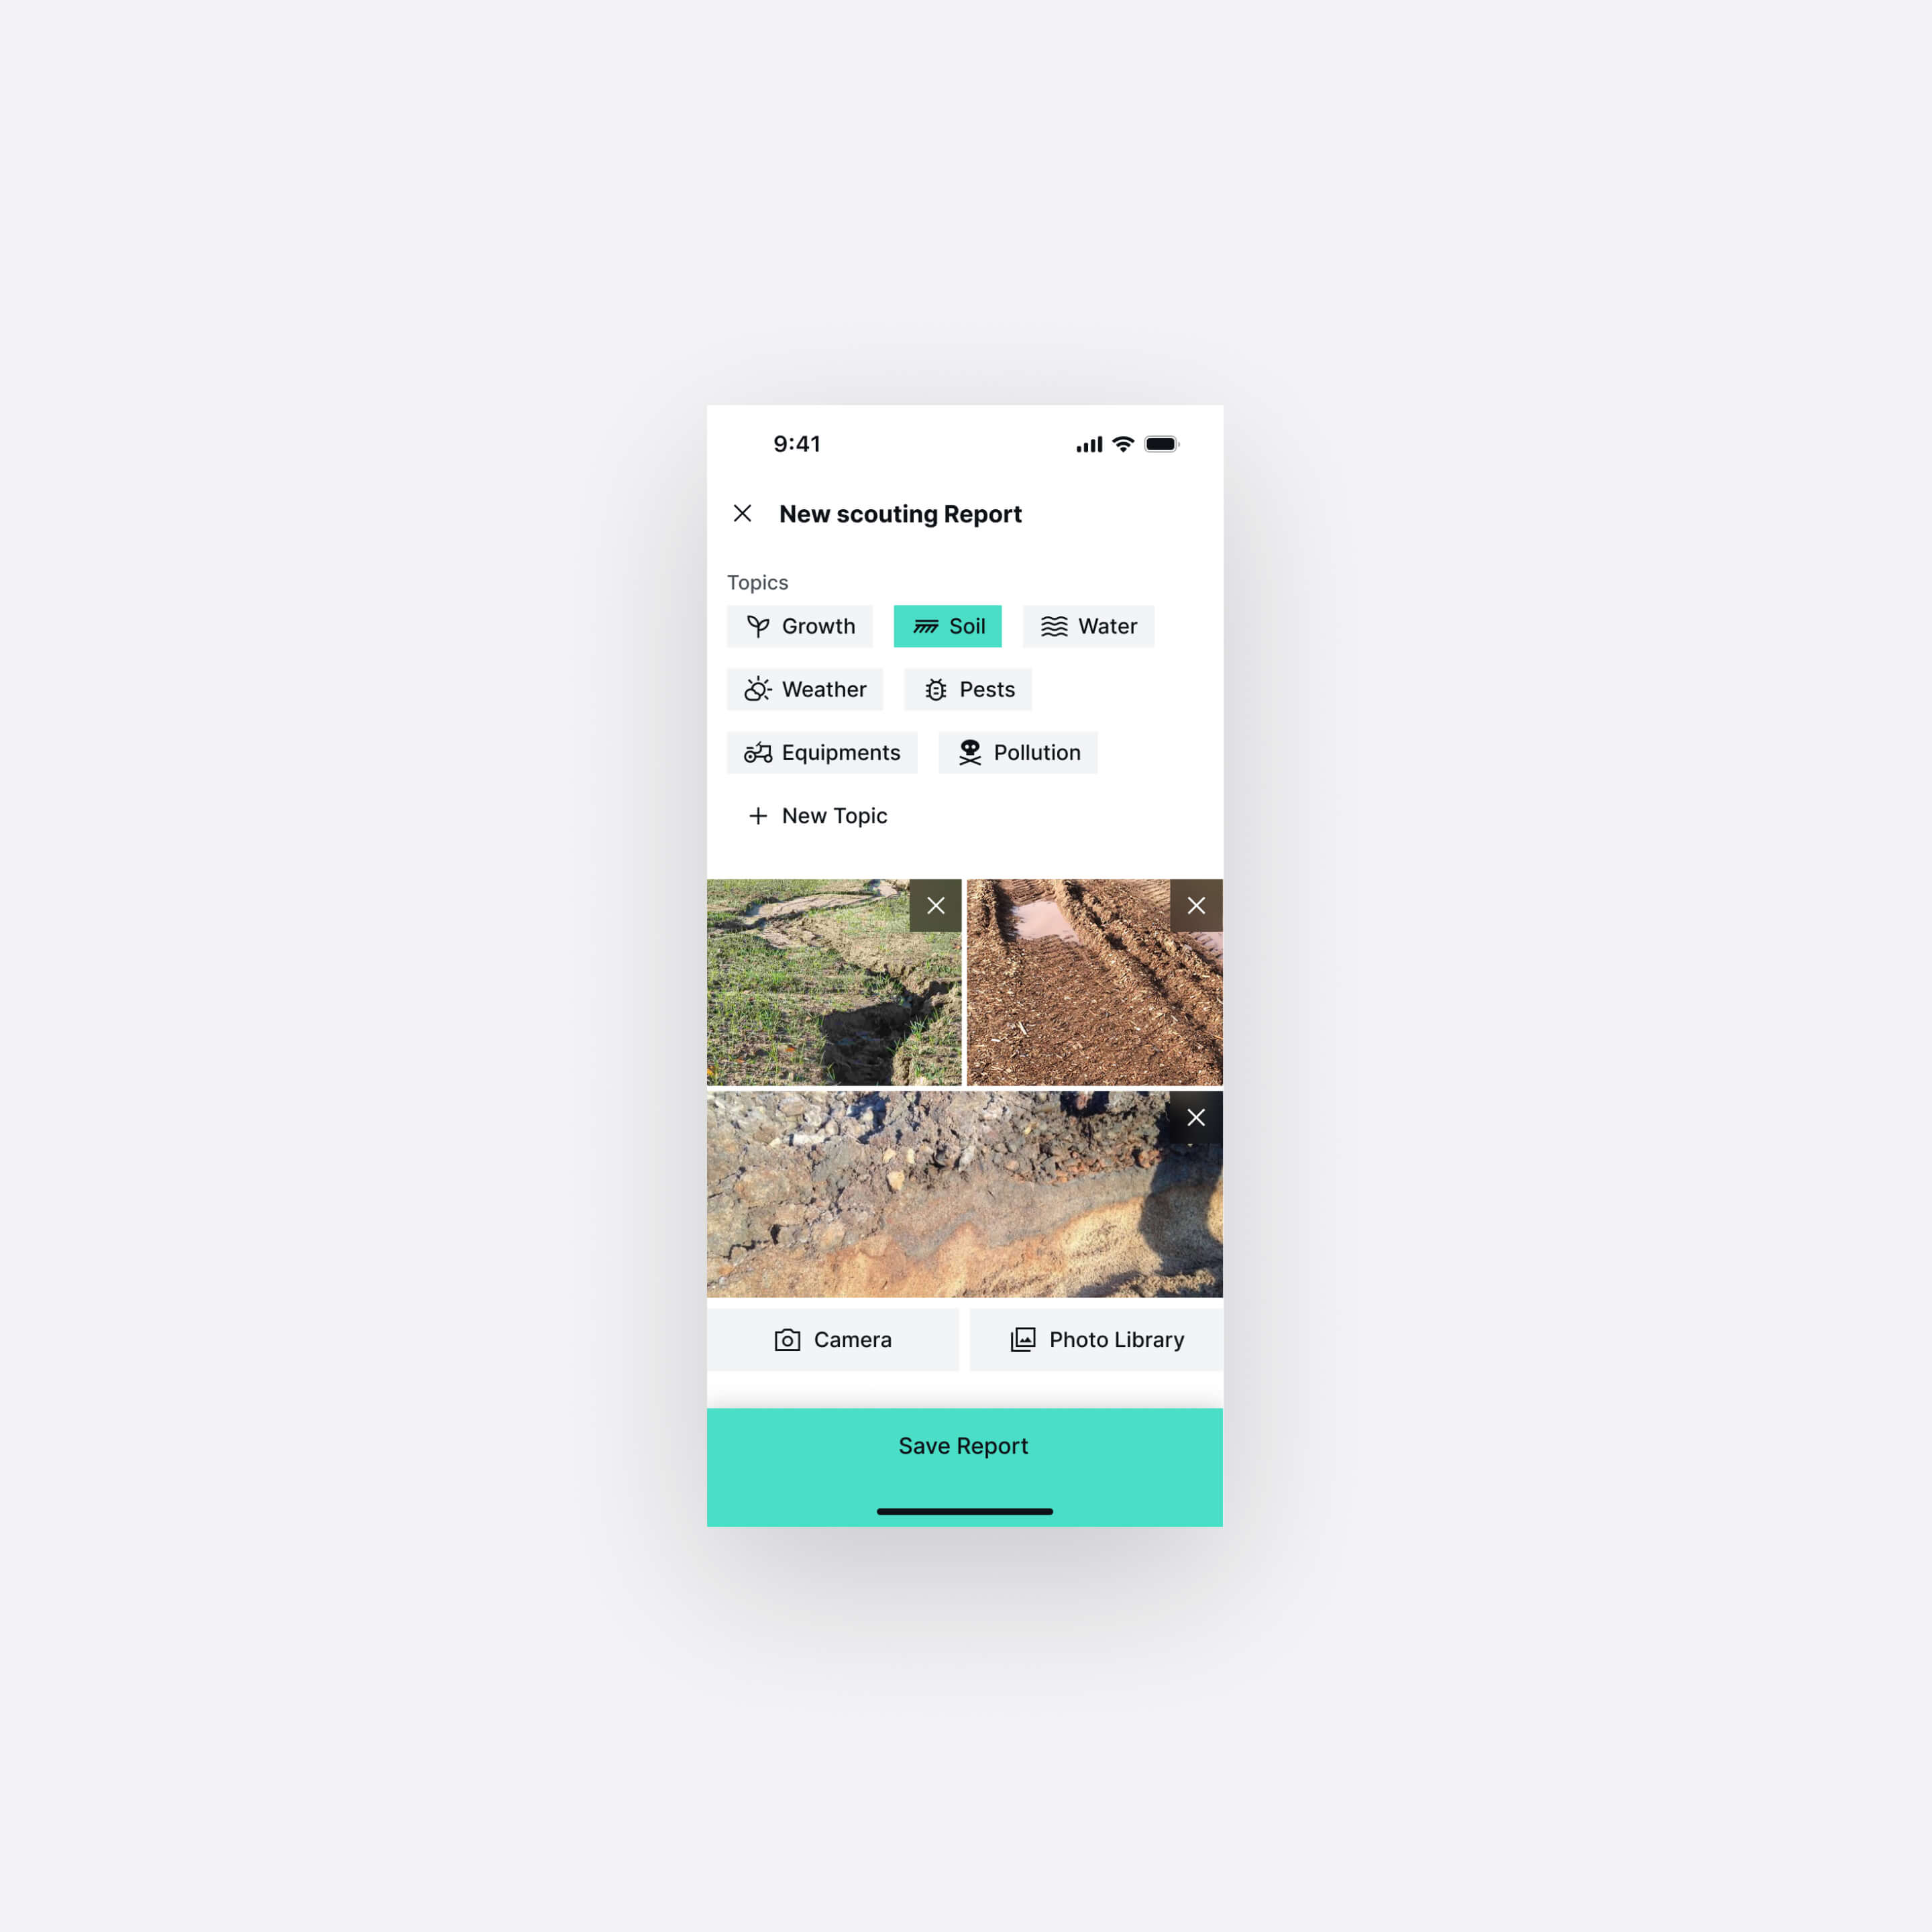
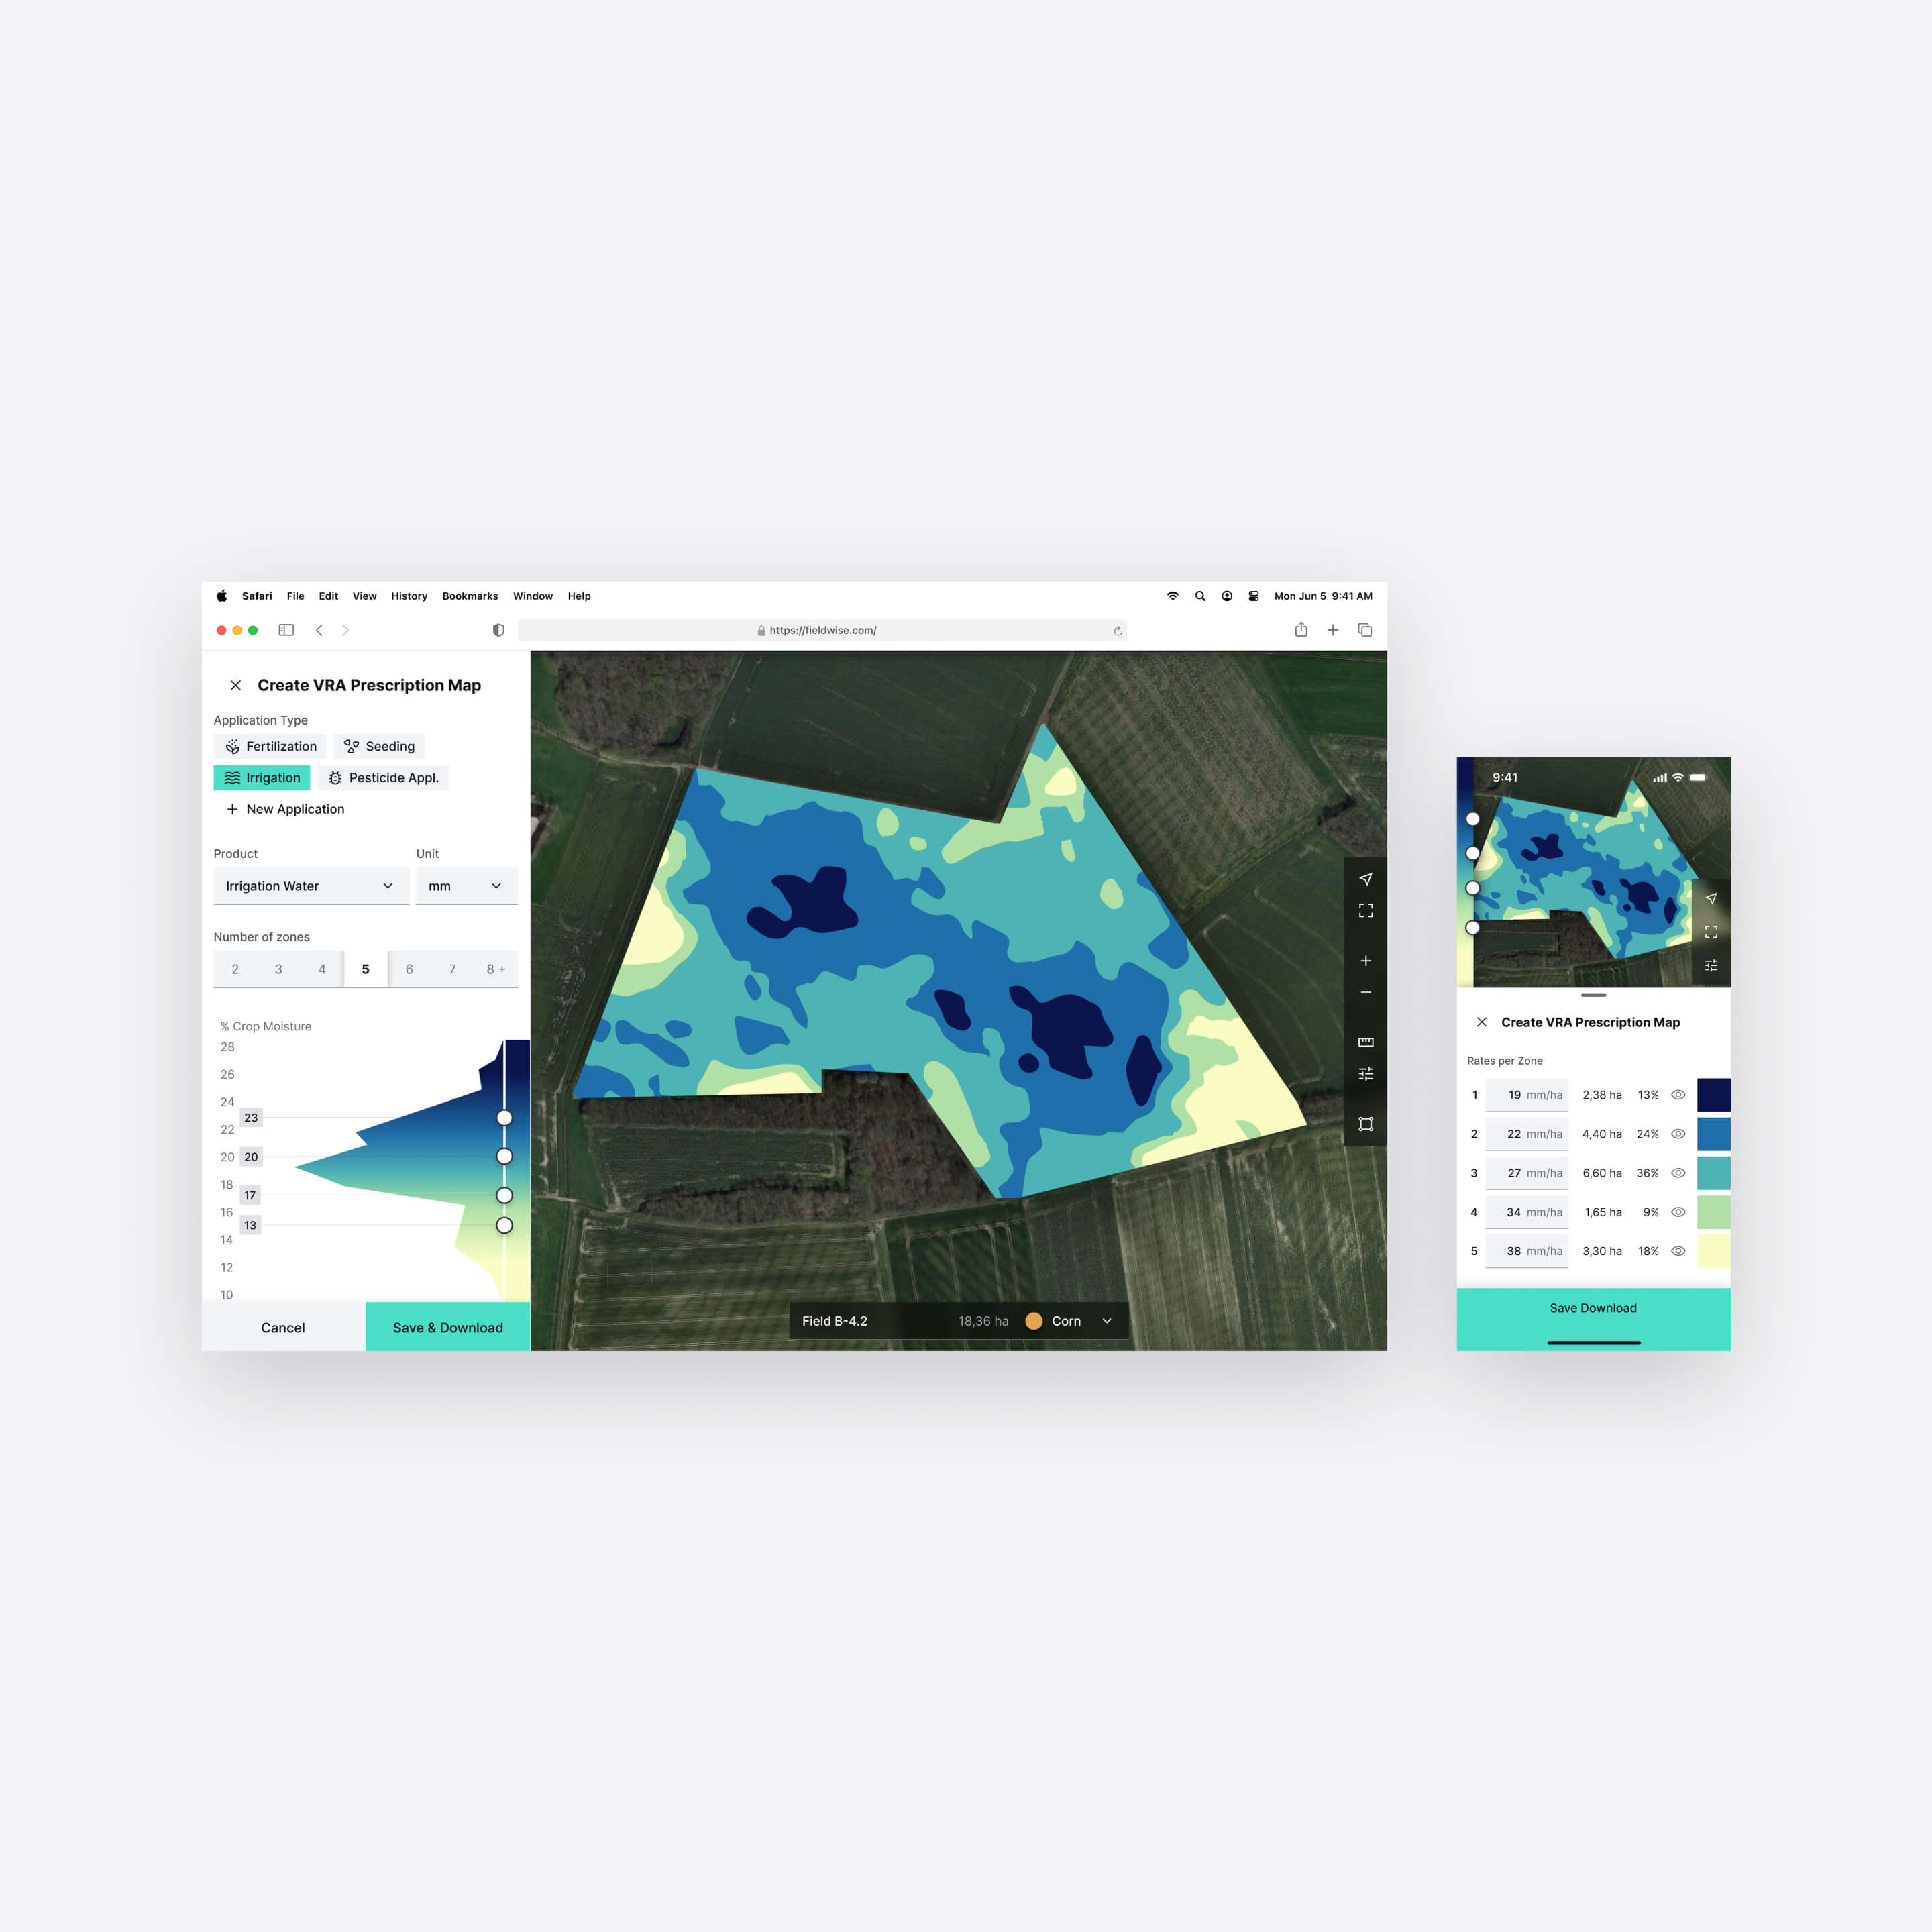
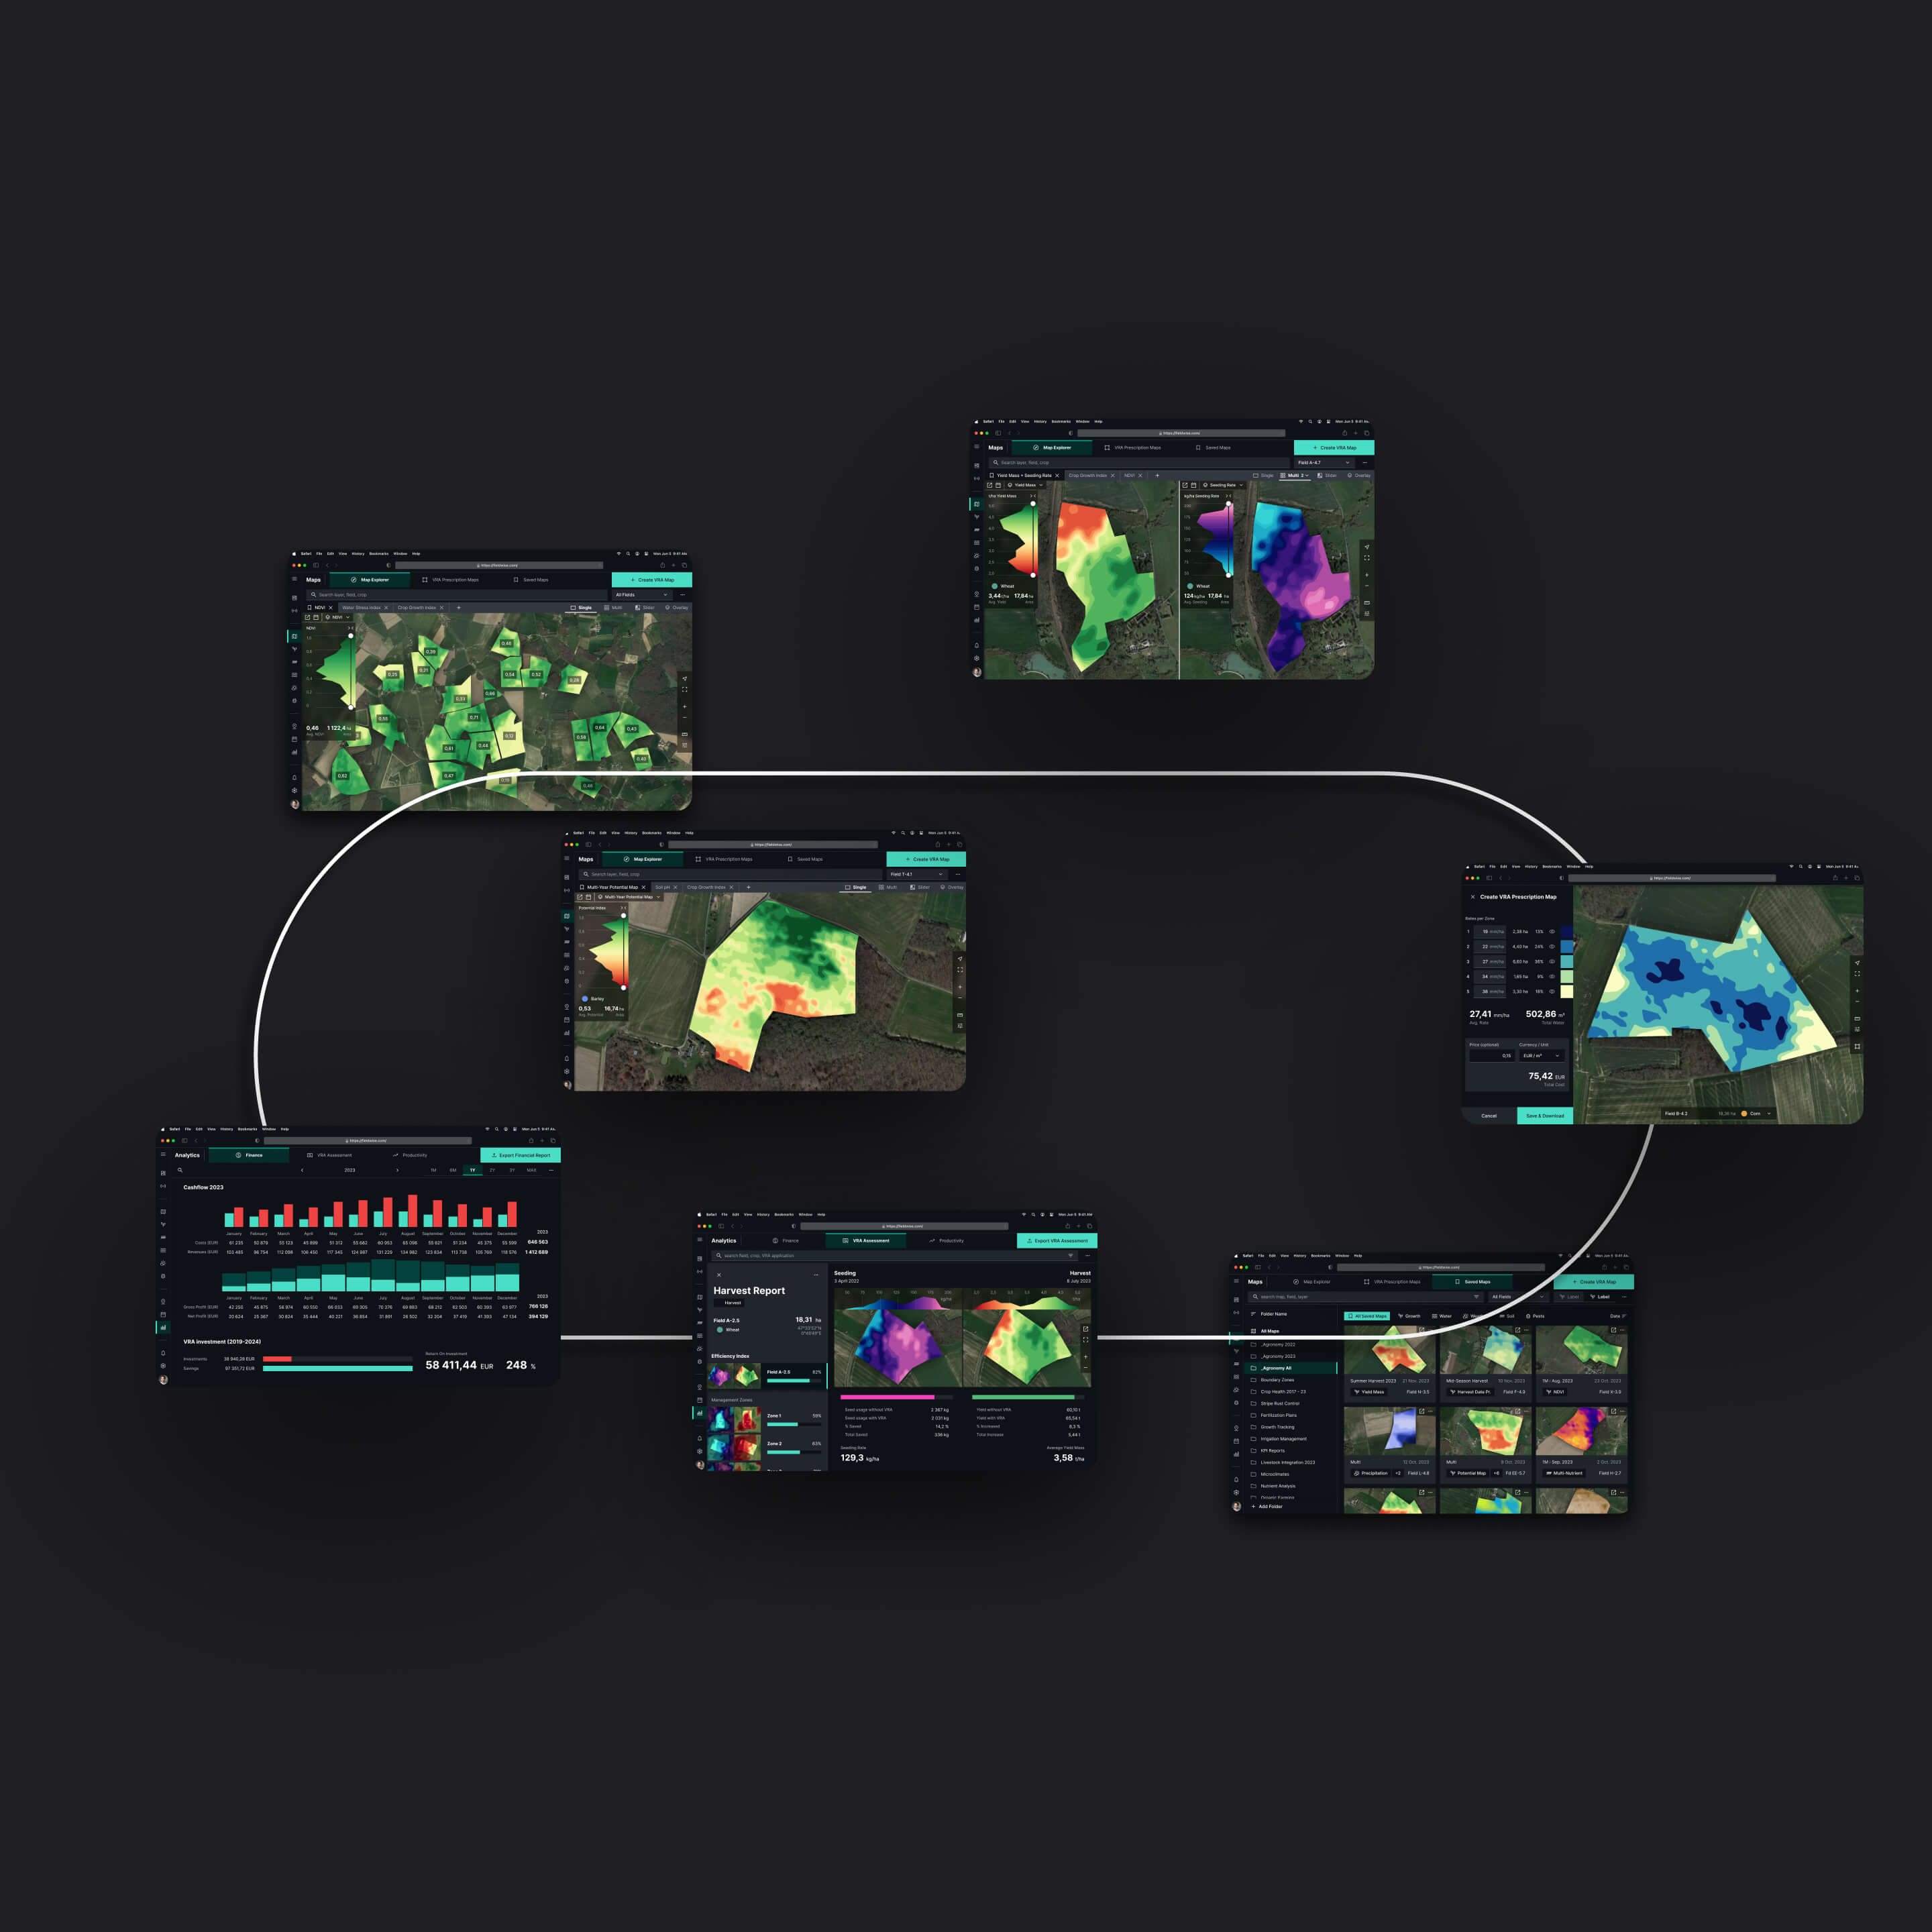
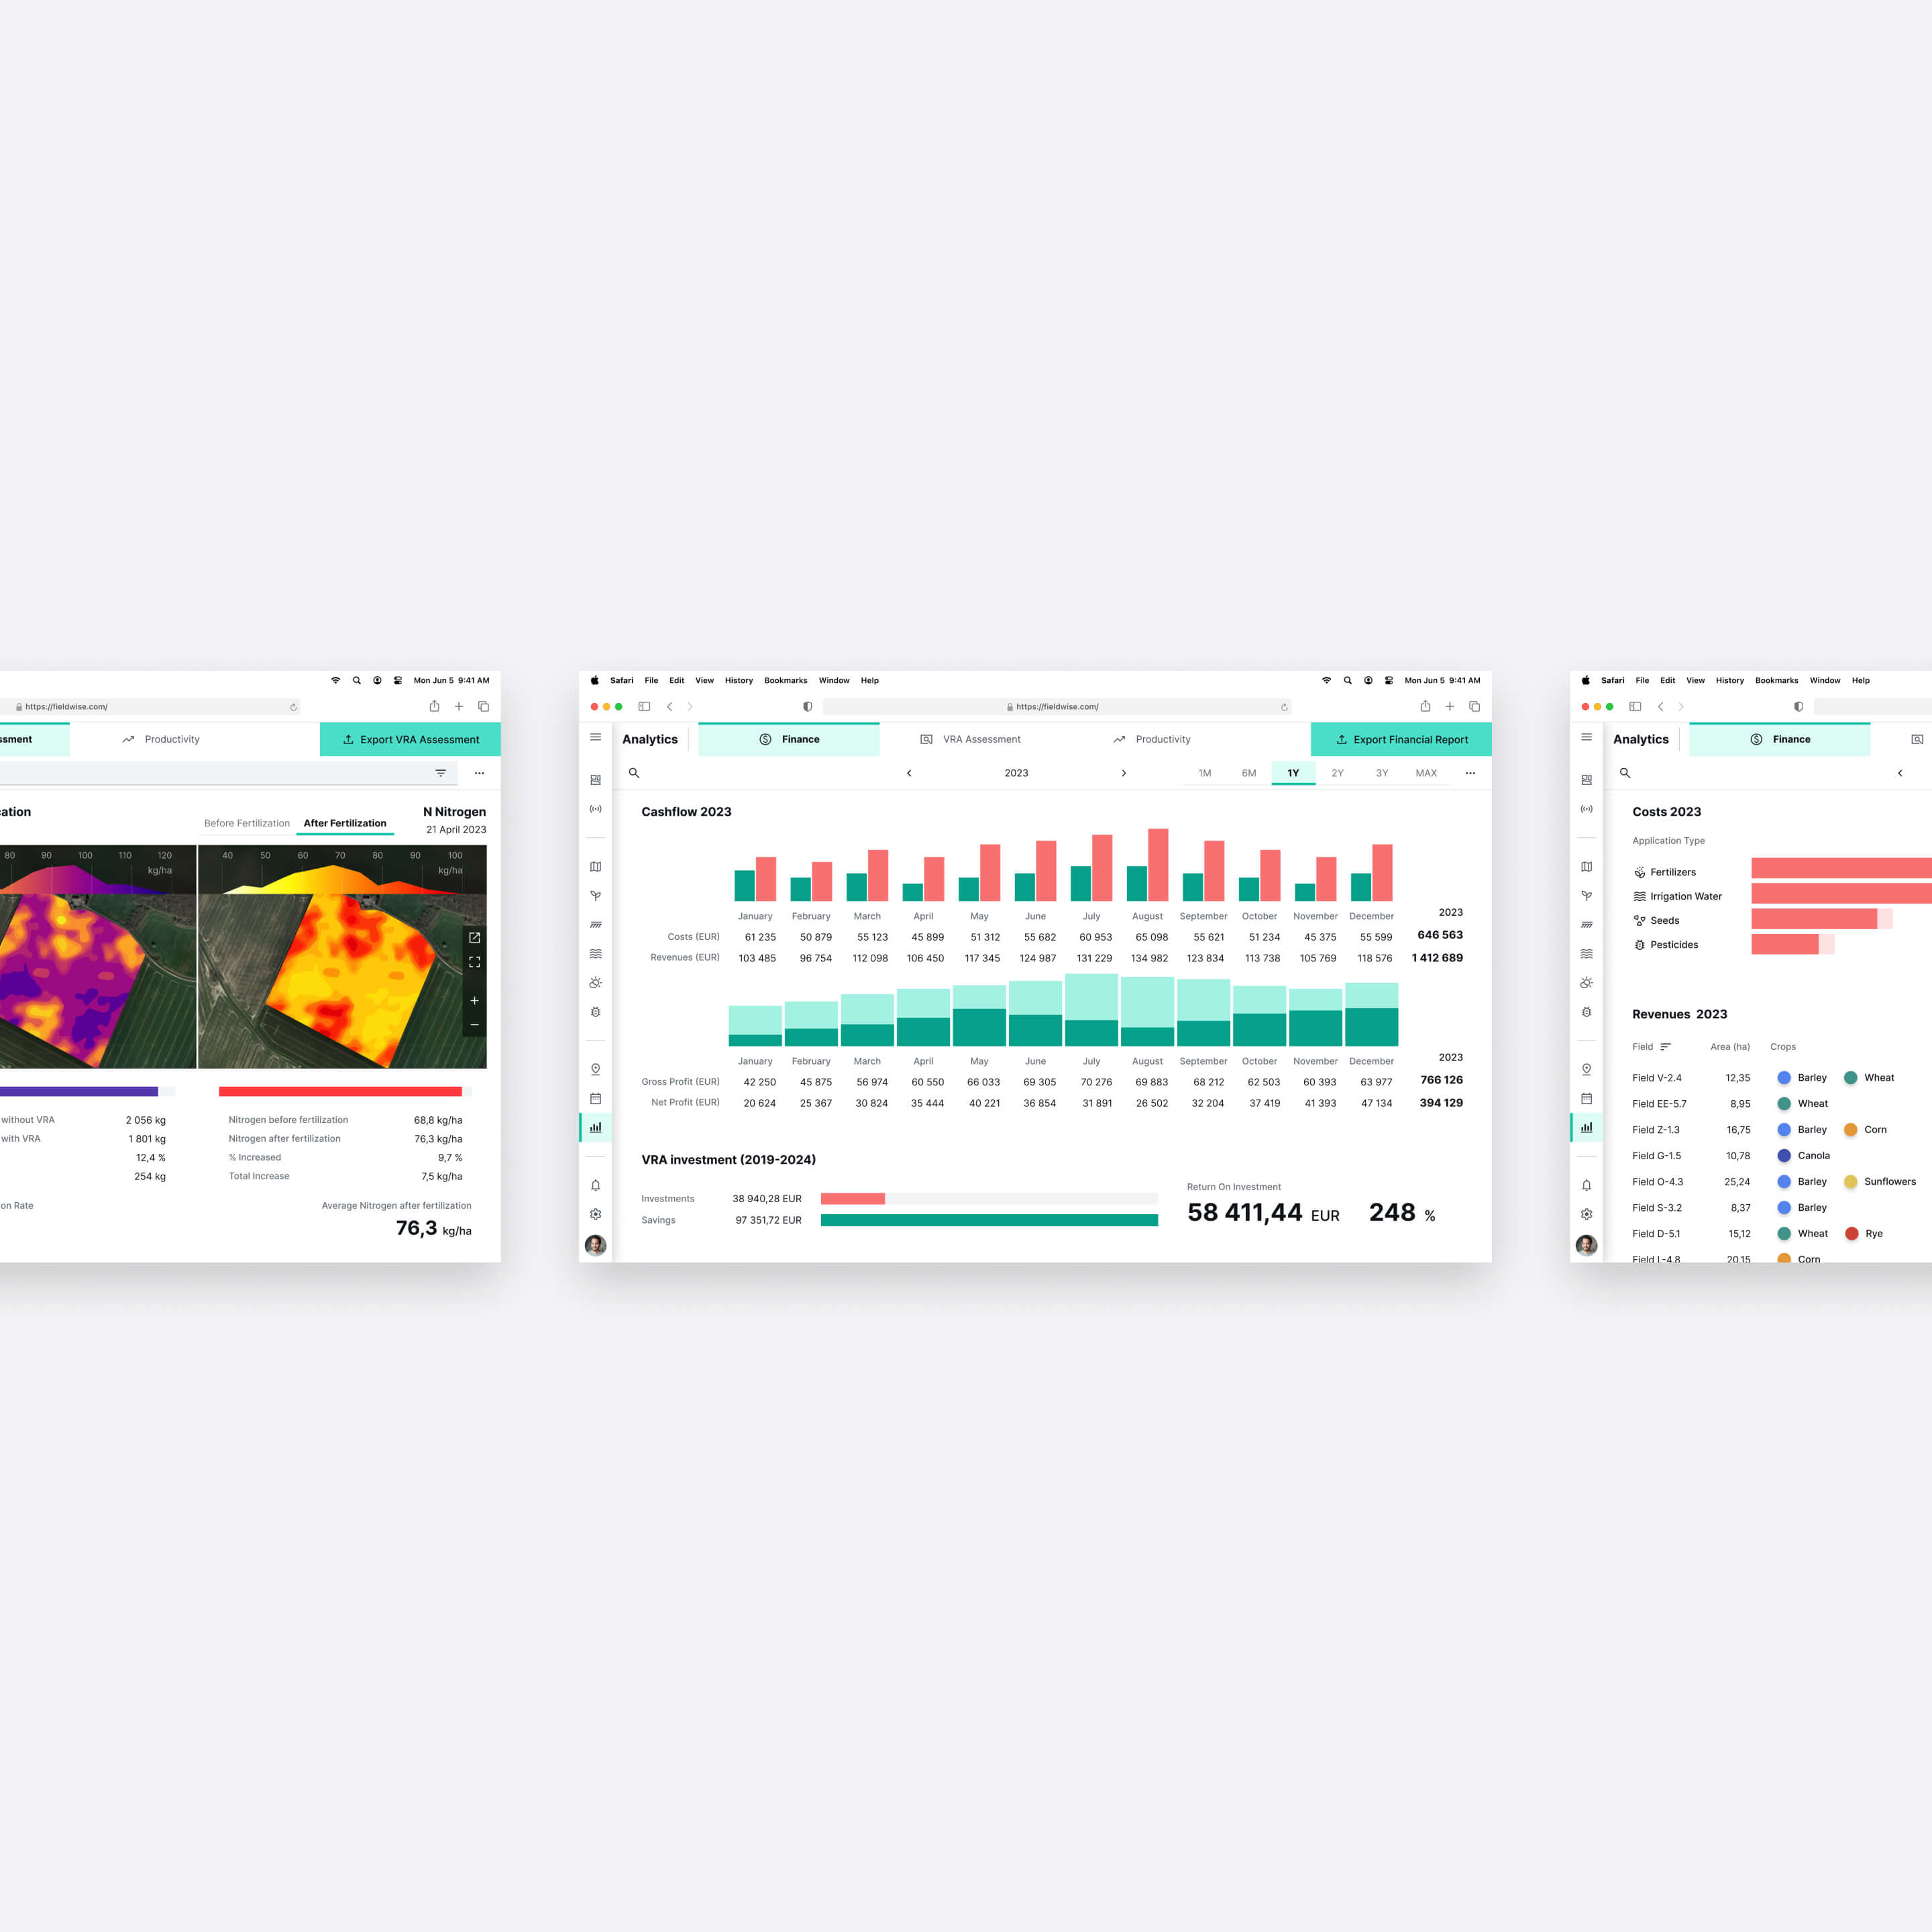
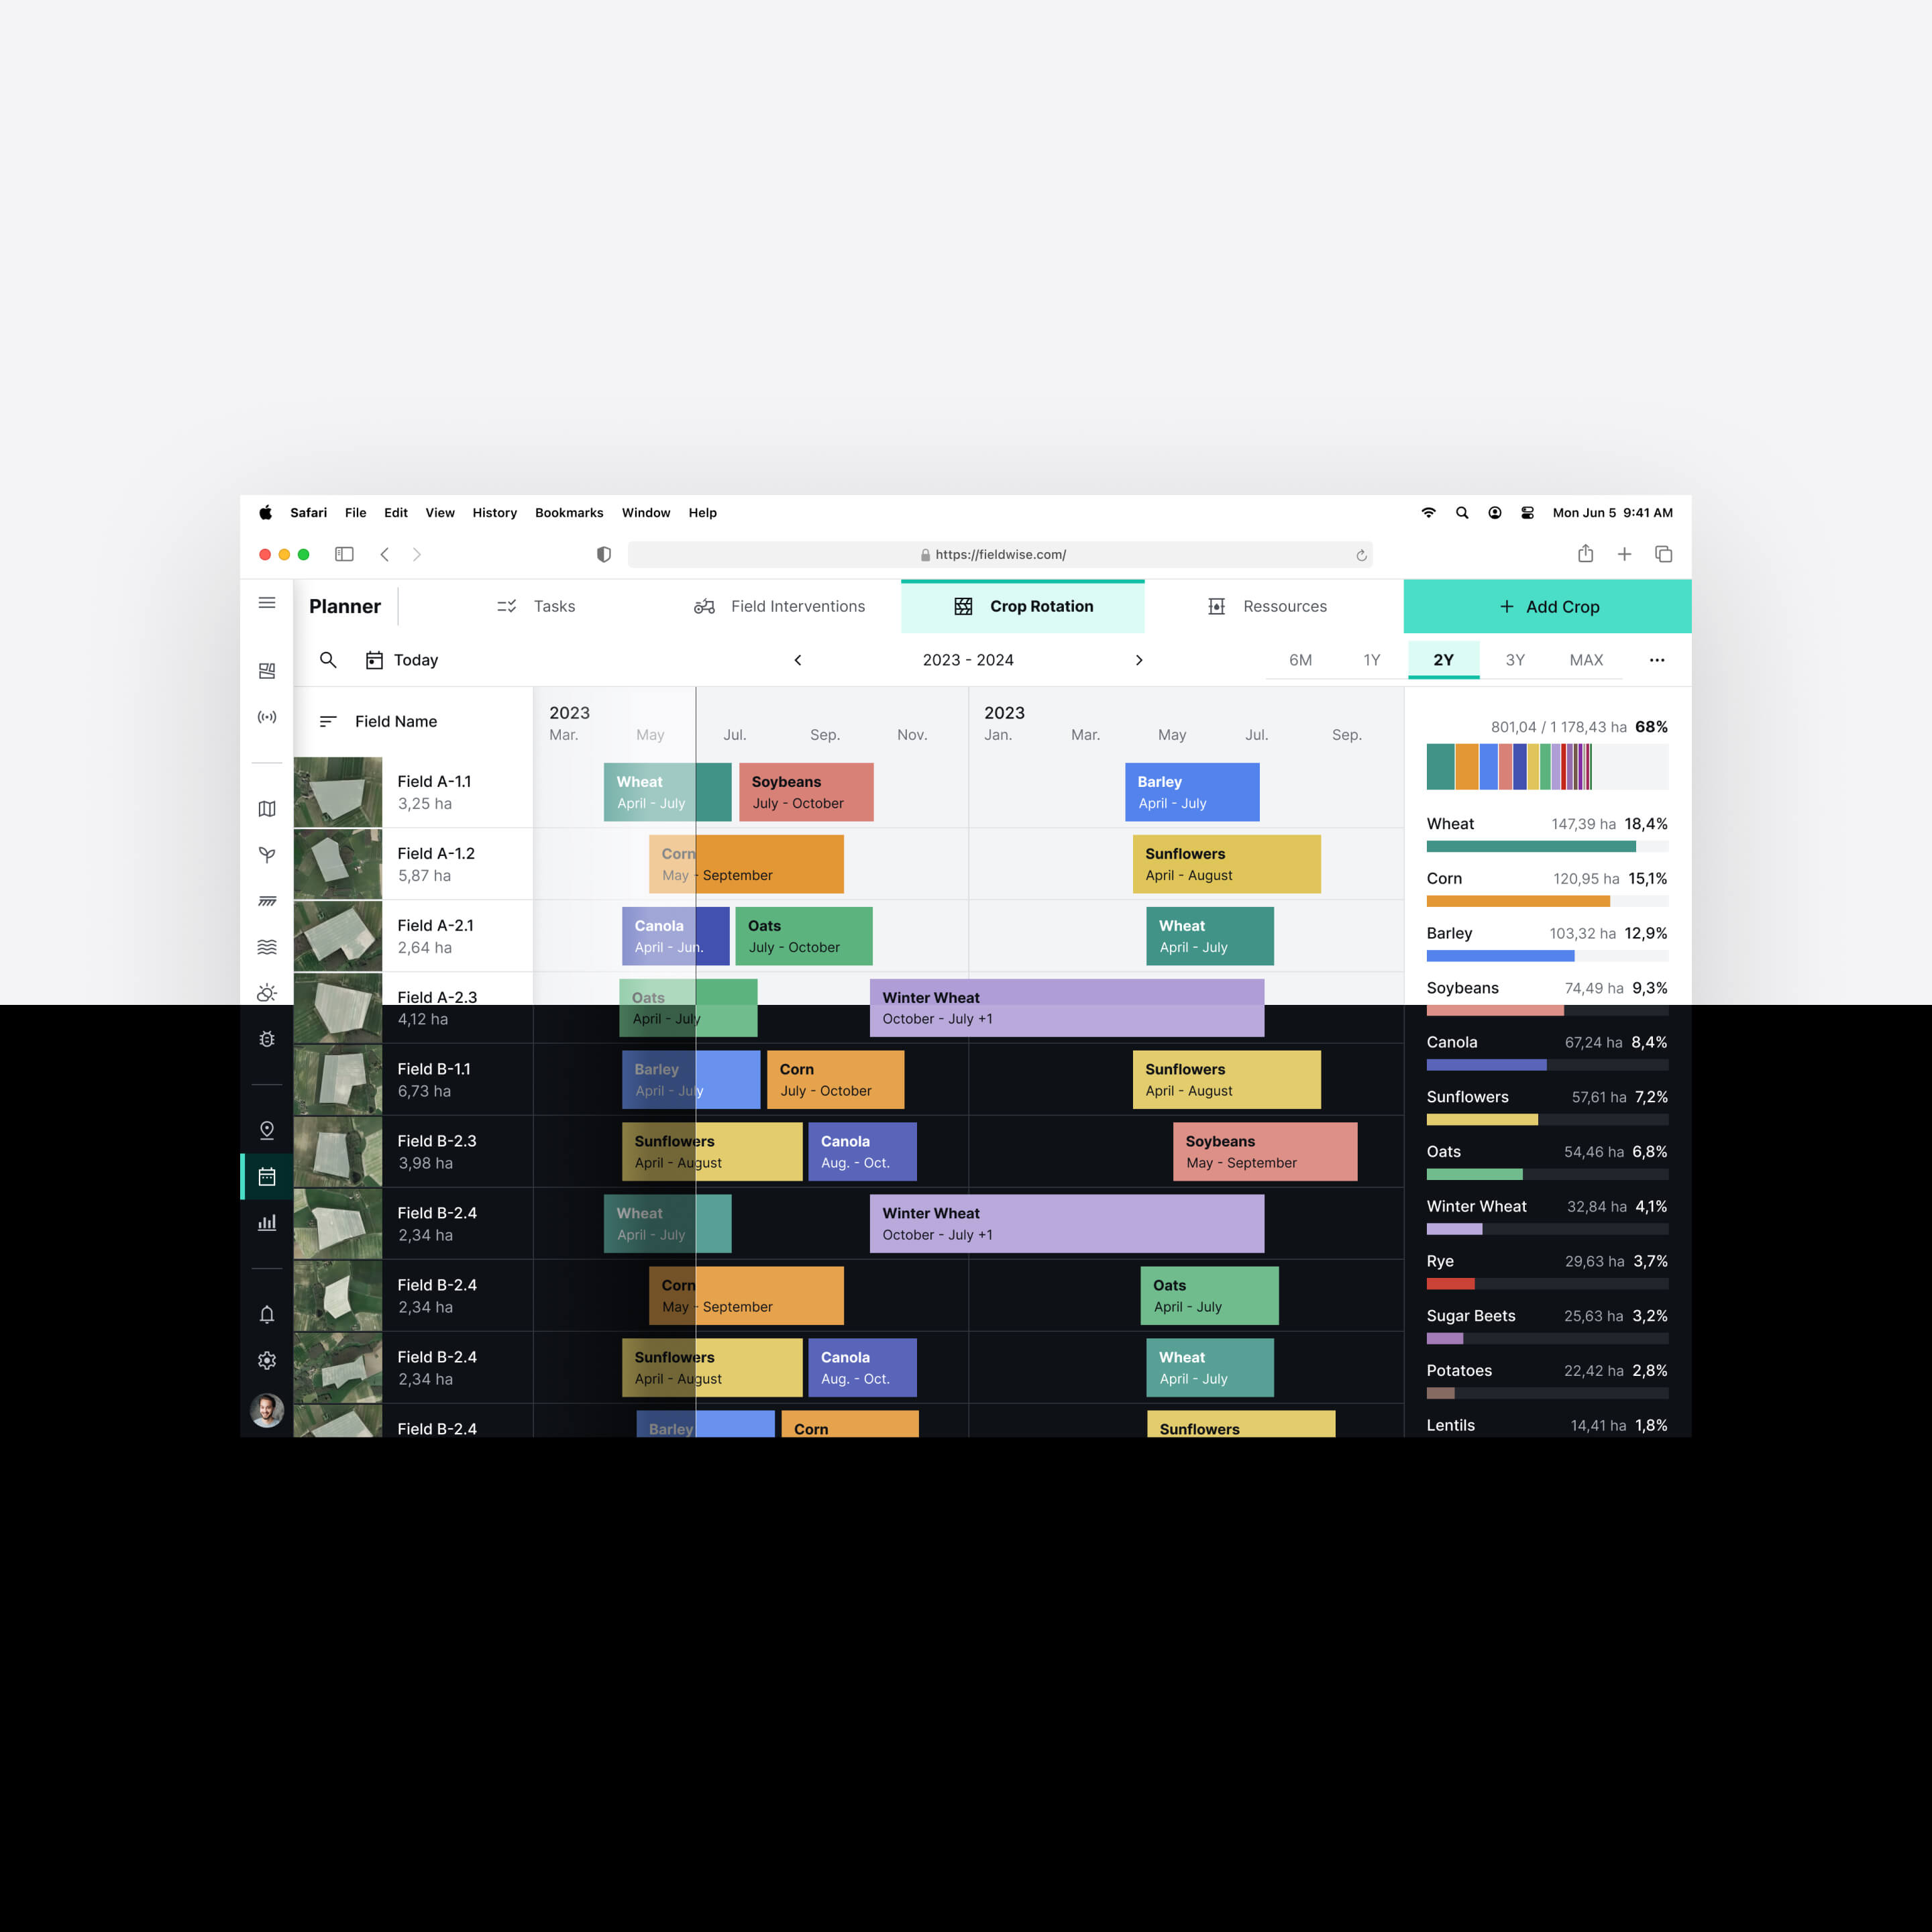
Designed a precision agriculture decision support platform from 0→1, combining satellite monitoring, field scouting, and advanced analytics into a unified interface that farmers can actually use.

The work addresses a real adoption gap: powerful AgTech tools that sit unused because they were built for data scientists, not the people working the land.

Project Setup
Self-initiated project
Industry
Agriculture & Ag-Tech
Date
2023
Timeline
3 months
Role
UX/UI Designer
Team
Solo designer
Platform
Web & Mobile
Keywords
0→1
AgTech
Data Visualization
Mapping
UX Research
Analytics Platform
Overview of Fieldwise dekstop platform. Computer screen displaying a field analysis software with NDVI plant health map, timeline settings, display options, and accessibility controls.
Problem

AgTech complexity limiting farmer adoption

Precision Agriculture and Variable Rate Application technologies have proven potential to increase yields and reduce chemical inputs. Yet adoption remains low, particularly among small and mid-size farms. The barriers are well documented: high costs, fragmented toolsets, limited digital infrastructure in rural areas, and software that assumes technical expertise most farmers simply do not have.

Diagram summarizing the precision agriculture process: acquire data, analyze, define smart actions, implement interventions, measure impact for improved yield, reduced input usage, and enhanced field homogeneity.
Diagram that I created using isometric Illustrations by macrovector on Freepik.

The deeper problem is that existing platforms were designed around data delivery, not decision support. They show farmers what is happening in their fields but rarely tell them what to do about it. The gap between having the data and knowing how to act on it is where adoption breaks down.

Desktop view of Fieldwise featuring a heatmap providing an overview of the crop field biomass across the entire farm.
Aerial view of a harvester unloading harvested crops into a tractor trailer beside a cultivated field.
Photo by no one cares on Unsplash.
UX Research

Understanding how farmers actually make decisions in the field

Three pages of a research paper, with the middle page titled 'Farm Computer Usage and Ownership' by USDA, and a magnified circle highlighting the number 25 on the right page.

Desk research

Grounded the project in published data on precision agriculture adoption. Key findings: only 25% of U.S. farmers currently use precision ag tools, with affordability and risk as primary barriers for smaller operations. Additional constraints include limited rural digital infrastructure, resistance to changing established practices, and the perceived complexity of tech-driven systems. (Source: USDA, 2021)

Farmer interviews

Conversations with South African farmers not yet using precision agriculture software revealed a strong reliance on gut feeling, direct field observation, and accumulated experience. Technology is viewed with skepticism unless it visibly aligns with and augments existing workflows rather than replacing them.
Affinity diagram summarizing qualitative insights gathered from user interviews.

Competitive analysis

Benchmarked leading precision agriculture platforms across UX maturity and feature coverage. Recurring gaps: no proactive action guidance, poor before/after comparison tools to measure intervention impact, and near-total absence of collaborative features for farm teams.
Comparative analysis matrix employed to evaluate existing solutions facilitating farmers in implementing variable rate application and precision agriculture.
"I walk my fields every morning. I know when something is off before any sensor does. What I need is a tool that confirms what I see and tells me what to do next."
— Johan / Commercial grain farmer, South Africa
"The data is there but I don't know what to make of it. My agronomist has to come and explain it every time."
— Pierre / Mid-size farm owner, reliant on external expertise for analytics interpretation

Crop scouting: balancing tradition and technology

Interviews revealed that direct observation (crop scouting) remains a cornerstone of crop farming, and is perceived as essential by farmers. While precision agriculture automates scouting, it poses challenges for traditional small farmers who value hands-on observation. This method excels in assessing crop health and interventions but faces limitations in scalability and resource constraints, especially for large farms. Then, striking a balance between tradition and technology appear to be crucial to increase the adoption of new Precision Agriculture technologies by farmers.
Photo of a man scouting a field, inspecting for potential pests or anomalies in crop growth.
Field scouting in "DIAMOND" shape pattern.
Field scouting in "W" shape pattern.
Field scouting in "X" shape pattern.
Field scouting in "O" shape pattern.
Scouts employ X, W, or V patterns for accurate field health assessment, occasionally walking along edges and outside rows for pest inspection. Patterns vary between trips and sections. Scouts choose three to five sample points, inspecting 10–20 plants or approximately 10 m2 at each location.(Photo by Erik 🖐 on Unsplash).
Key pain points

Complex analytics, limited actionability

Tech complexity, adoption barriers, and disconnected workflows hindered wider adoption.

High technical barrier

Platforms assume familiarity with digital analytics and agronomic data models, making them intimidating for users with limited digital experience or training.

Data without guidance

Metrics and maps are presented without interpretation or clear next steps, increasing uncertainty and reinforcing risk aversion rather than building confidence.

Disconnected workflows

Field observations, sensor data, and analytics tools exist in separate silos with no unified decision flow connecting them.

No integration of field intuition

Existing tools fail to incorporate crop scouting, direct observation, and the experiential knowledge farmers rely on most, creating a disconnect between the platform and real working practices.

Limited collaboration

Farm teams lack structured ways to share observations, compare interventions, and align on decisions, leaving knowledge fragmented across individuals.
Photo of a person manually harvesting in a field.
Aerial view of a green combine harvester working on a brown crop field, harvesting and separating grain.
Photos by Scott Goodwill & Tim Mossholder on Unsplash.
UX Strategy

From raw analytics to decision support: where human wisdom meets precision technology

Designed Fieldwise to work with the way farmers already think: observe, assess, act, measure. Rather than forcing users to extract meaning from raw data, the interface surfaces contextual interpretation, actionable recommendations, and measurable impact at each step of that cycle. The strategy also prioritized collaborative workflows, recognizing that field decisions are rarely made by one person alone.

Diagram illustrating key steps in Fieldwise software: acquire data, analyze, define actions, implement precision interventions, measure impact for improved yield and efficiency.
Farmers do not resist technology. They resist technology that ignores what they already know.
01

Bridge field practice and digital precision

Integrate crop scouting and experiential field knowledge directly into the platform alongside satellite monitoring and sensor data, creating a unified view that respects and extends what farmers already do.
02

Deliver actionable insights

Move beyond metrics to provide contextual interpretation, cost-aware recommendations, and tools to measure the actual impact of every intervention on yield and input usage.
03

Enable collaborative workflows

Support shared observations, team commenting, task assignment, and transparent decision tracking so that knowledge is captured, shared, and built upon across the whole farm operation.
Isometric view of three desktop screens on the Fieldwise platform, each showcasing different heatmaps for monitoring crop growth and field biomass.
Iterations & Design Solutions

Designing actionable agricultural analytics: from field observation to precision intervention

Designed the full platform experience across desktop and mobile, covering the complete precision agriculture workflow: data acquisition, analysis, prescription, intervention, and impact measurement.

A key design challenge was maintaining usability for non-technical users while preserving the depth and granularity that agronomists and larger operations require. IBM's Carbon Design System was adopted and extended to ensure a solid, consistent UI foundation aligned with the platform's technical complexity.

Map explorer dashboard

Central interactive map interface overlaying crop growth, soil moisture, water stress, weather, and pest data in categorized layers, giving farmers a real-time field overview without overwhelming them with simultaneous information.
Agricultural software interface displaying NDVI vegetation index maps with risk levels for various fields shown on a desktop and mobile screen.

Layered insight architecture

Designed a clear platform navigation structure grouping map data into five core insight categories: growth, soil, water, weather, and pests. Users navigate between layers fluidly without losing spatial context.
Focus on the vertical navigation bar on the desktop version of Fieldwise with options like Fields, Sensors, Maps, Growth, Soil, Water, Weather, Pests, Scouting, Planner, Analytics, Notifications, and Settings.
Diagram illustrating the hierarchy of all map layers integrated in Fieldwise software, categorized for user convenience into five main sections: growth, soil, water, weather, and pests.

Comparative map views

Built comparison tools enabling farmers to track field changes over time through browser tab comparison, multi-window maps, multi-layer overlays, and a side-by-side slider, making before/after impact assessment intuitive and accessible.
Desktop view of Fieldwise Map Explorer featuring a comparative slider for precise comparison of heatmap data between two different maps.

Mobile scouting reports

Designed a mobile-first interface for recording geolocated field observations in the field, with photo capture, descriptions, and intelligent grouping for a comprehensive view of scouting activity across the farm.
Photo of an individual using the Fieldwise app to log scouting reports while on the move.
Mobile view of the Scouting Report modal in Fieldwise.
Mobile content from this fieldwise project & integrated into the photo by jcomp on Freepik.
Integrated team chats for collaborative commenting on scouting reports, available on both mobile and desktop platforms.

Collaborative decision tools

Integrated team sharing, contextual commenting, and task assignment at the observation level, enabling farm teams to align on field conditions and coordinate interventions without leaving the platform.

Field oversight and real-time monitoring

Combined smart sensor data and satellite analysis into a continuous monitoring layer with automated early issue detection. Insights are organized into dedicated map explorer tabs by field and parameter, giving farmers an always-current view of crop growth, water stress, nutrient levels, weather conditions, and pest presence.
Desktop views featuring a list of sensors in the software, consistently monitoring fields.

Prescription maps and VRA controls

Surfaced system-generated prescription maps for Variable Rate Application alongside tools for creating custom care zones, giving farmers direct control over where and how inputs are applied.
Responsive modal for both desktop and mobile, facilitating the generation of variable application rate maps with customizable care zones.
Desktop screen displaying all prescription maps generated by a user.
Looped sequence of various desktop screens illustrating the iterative process of consistently measuring the impact of precision agriculture interventions to enhance intelligent actions on fields.
Desktop yield reports for measuring the impact of precision agriculture interventions on production.

Impact measurement reports

Designed automated post-intervention yield reports triggered by each VRA application, closing the feedback loop and helping farmers assess ROI and refine future decisions.

Reports and smart analytics

Built tailored farm productivity dashboards covering cost estimation, yield analysis, field potential, and soil quality, supporting long-term planning and evidence-based decision making.
Analytics reports accessible in the desktop version of Fieldwise, providing users with essential insights into agricultural productivity and farm finance.
Crop rotation planning seamlessly integrated into Fieldwise software, demonstrated in both light and dark themes.

Dark theme and data visualization

Designed both light and dark themes, with the dark mode optimized for map-heavy screens where heatmaps and overlaid visualizations require maximum contrast and legibility. Custom agricultural data visualizations were built throughout.

Design system and brand identity

Adopted and extended IBM's Carbon Design System to fit precision agriculture requirements. Developed Fieldwise's full brand identity, including naming, logo (a plant form integrated with the letter W for wisdom), a green and grey palette rooted in agriculture and technology, and a consistent component library across all screens.
Fieldwise design system overview.
Overview of Fieldwise Service identity and branding.
EXPECTED Impact

Improving decision speed, input efficiency, and farm team alignment

35%
faster decision-making for targeted interventions
50%
reduction in redundant field trips through integrated scouting and analytics
20%
increase in input efficiency for fertilizer and water usage

Faster intervention decisions

Contextual interpretation and actionable recommendations reduce the time between detecting a field issue and deciding what to do about it.

Reduced input waste

Precision targeting through VRA prescription maps and optimization guidance lowers unnecessary fertilizer and water application across fields.

Better use of field knowledge

Integrated scouting tools capture and surface the observational expertise farmers already have, making intuition a structured, shareable input rather than a personal one.

Stronger team alignment

Collaborative features enable farm teams to share observations, comment on conditions, and coordinate decisions within a single workflow rather than across disconnected conversations.

Measurable intervention impact

Automated post-application reports give farmers a direct feedback loop between actions taken and outcomes achieved, building confidence and improving future decisions.

Reduced operational costs

through clearer interpretation of complex field data
Computer screens displaying various agriculture management dashboards including field maps, crop rotation schedules, sensor data, task planner, and water stress index.
Takeaway

Accelerating precision farming adoption: by designing for the farmer, not the data

Fieldwise started from a research insight that changed the design direction entirely: farmers do not resist technology because they are unfamiliar with data. They resist it because most platforms ignore the knowledge they already have.

By designing a decision support system that integrates field intuition, collaborative workflows, and precise analytics into a single coherent experience, Fieldwise bridges the gap between what precision agriculture promises and what farmers can realistically adopt. The project reinforced that in complex, high-stakes domains, the most important design decision is often choosing whose mental model to design around.

Disclaimer

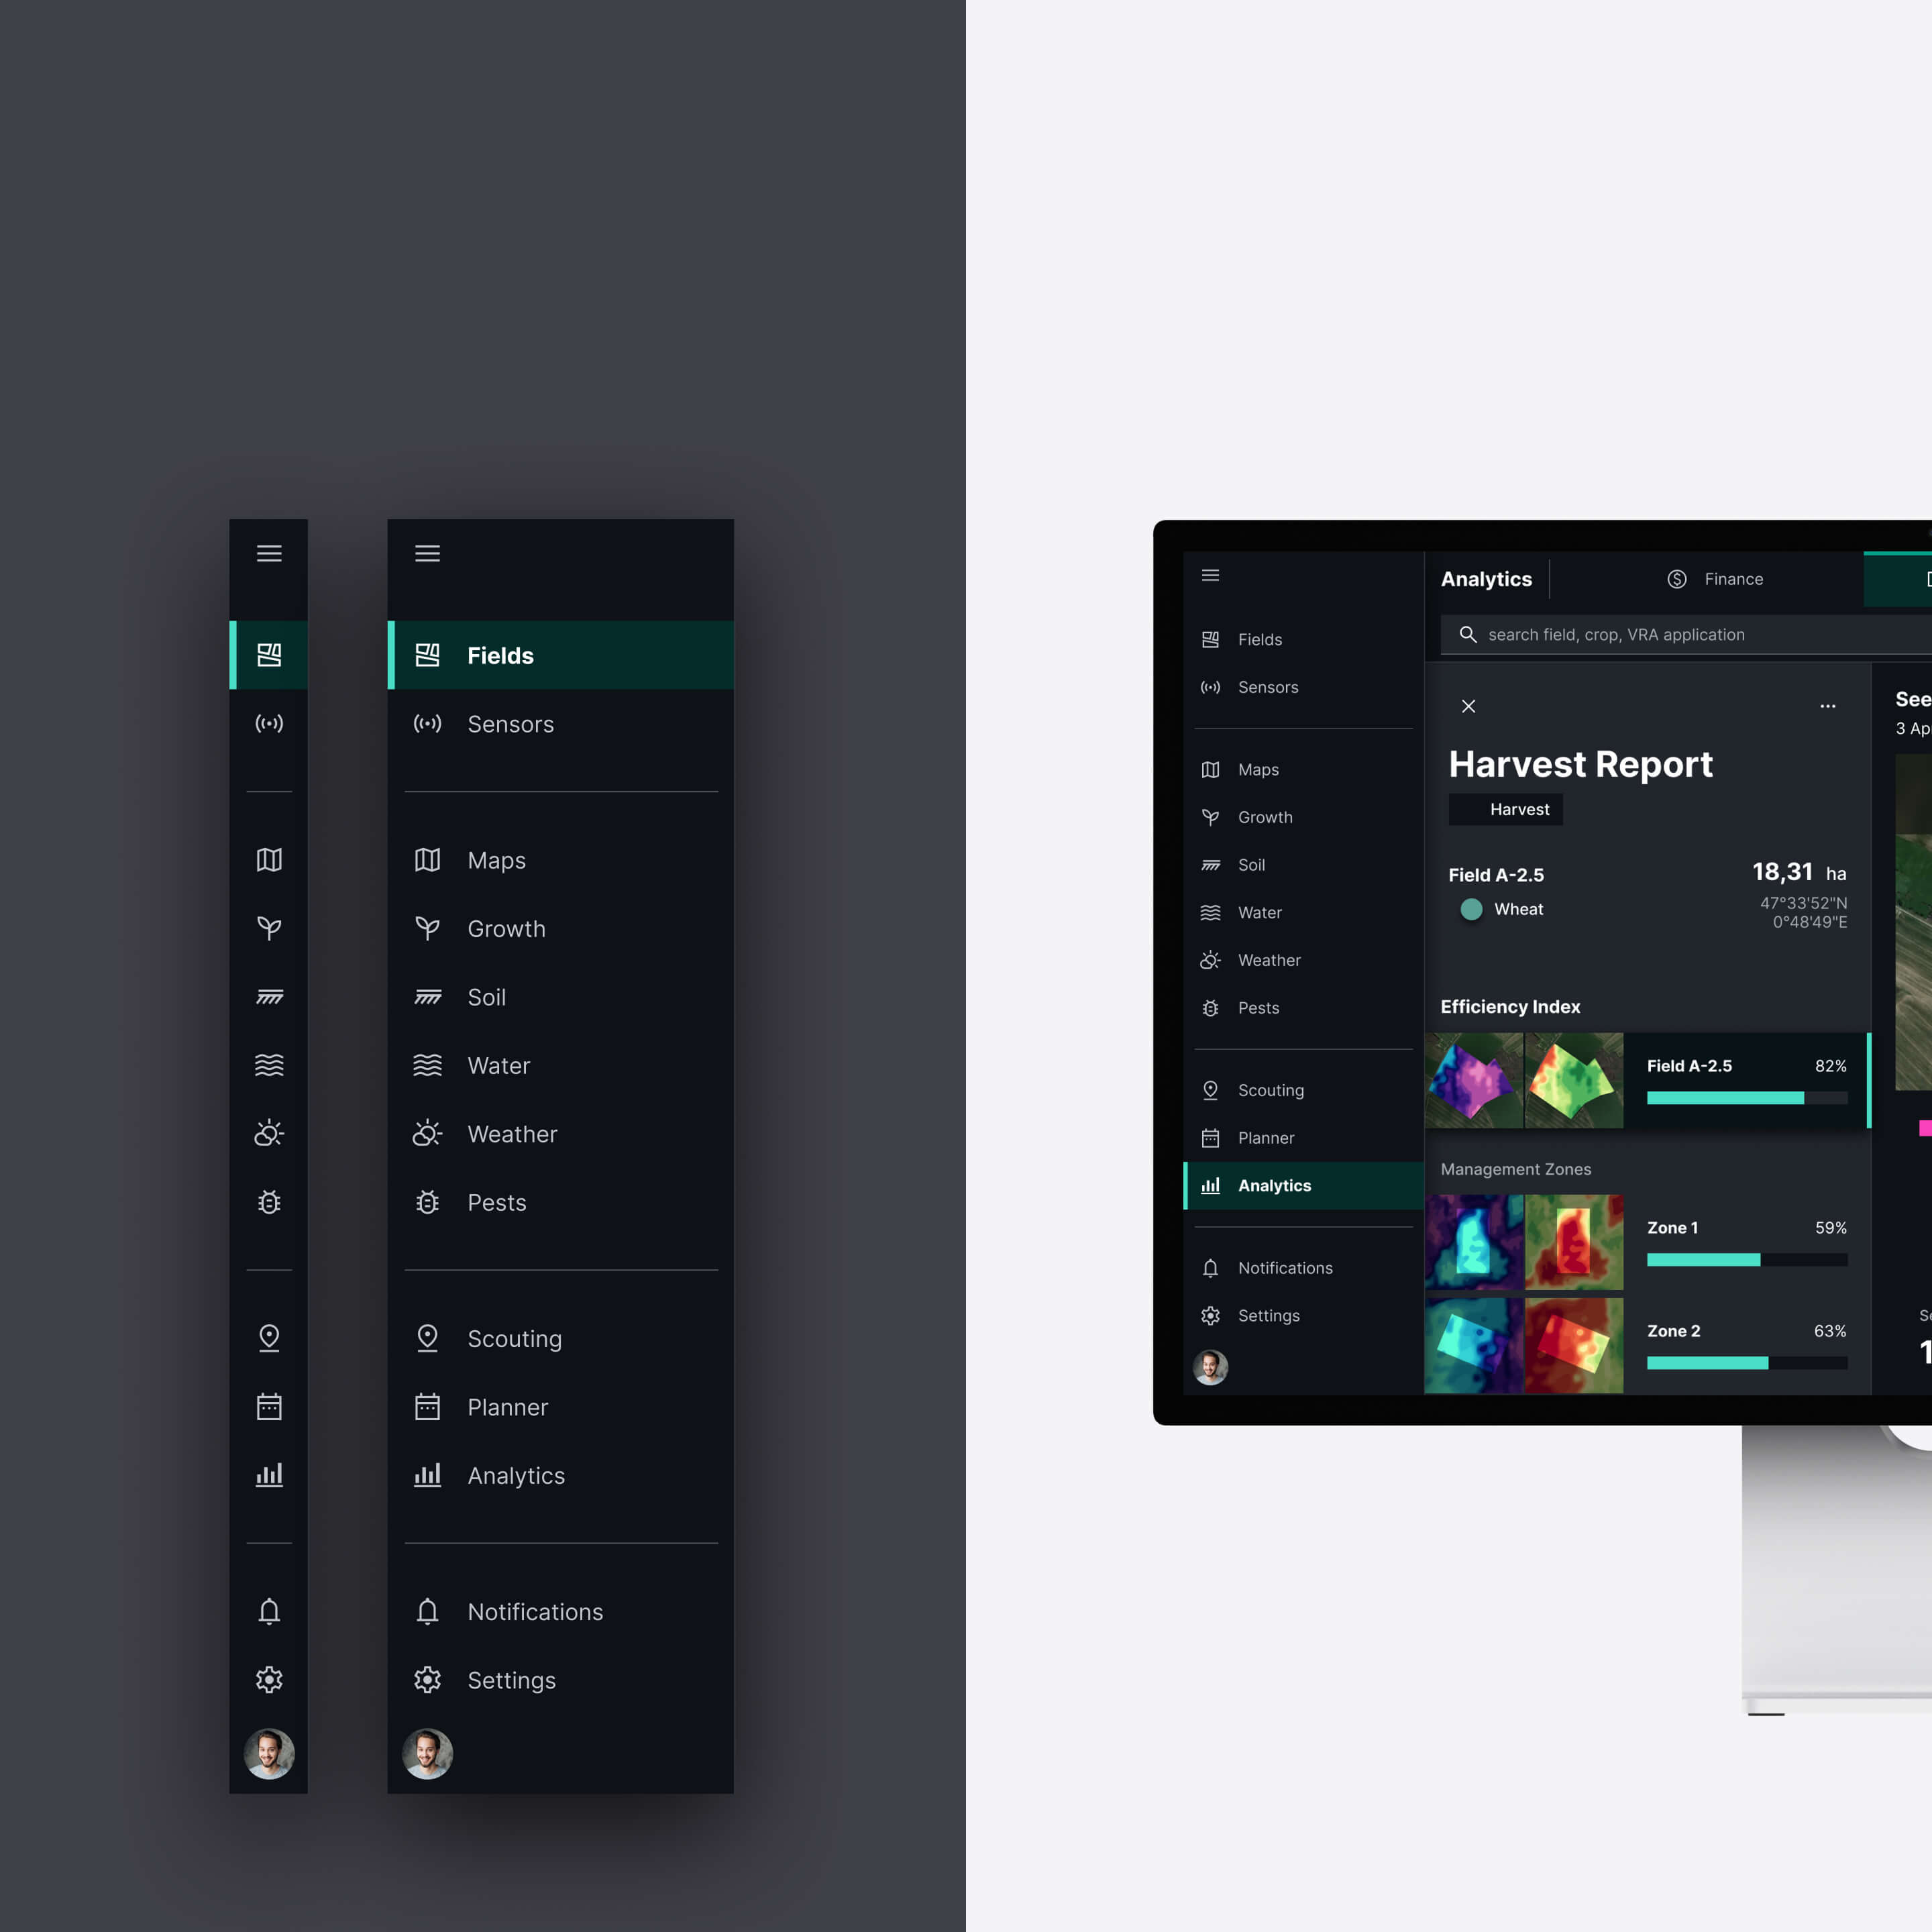
This is a self-initiated concept project. Fieldwise is not affiliated with any existing precision agriculture company or platform. All content, screens, and data have been created for portfolio purposes to explore real UX and decision support challenges in the AgTech space.

Any quantitative metrics presented reflect typical outcomes that could be expected from such a concept, but they are not based on real-world field data or validated measurements. They are illustrative in nature. I recognize that measuring UX impact is a critical step in any UX project, and that proper validation is essential to assess whether design decisions effectively move the user experience in the right direction.

Mobile view of the map explorer in Fieldwise, enabling users to visualize field health using heatmaps and filter data through interactive charts.
Bioflow app overview on mobile. / Various mobile views on the Bioflow platform, improving the user experience for viewing digital lab test results.